Living season tracker
The Ravens
Season Dashboard
2026 Season · Updated October 23, 2026 · Through Week 7 · Cincinnati Bengals next
AFC North
Current streak: L1The games that frame the week
Game Center
Last-game production alongside the next opponent's statistical profile and reported availability.
Regular season
Last Game
at Cleveland Browns · Oct 18
The Ravens lost to the Cleveland Browns 10–13.
- Scrimmage yards
- 235–237 Ravens–opponent
- EPA / play
- -0.07 / -0.12 Ravens / opponent
- Success rate
- 33.9% / 43.3% Ravens / opponent
- Turnovers
- 1–0 Ravens–opponent
Week 7
Next Game
vs. Cincinnati Bengals · Oct 25 · 1:00 PM ET
M&T Bank Stadium
When the Ravens have the ballEPA / play
- BAL
- 0.12 No. 7
- CIN
- -0.03 No. 14
The Ravens' big-play testExplosive rate
- BAL
- 12.8 No. 3
- CIN
- 12.8 No. 32
When the opponent has the ballEPA / play
- BAL
- -0.04 No. 10
- CIN
- 0.07 No. 9
The red-zone matchupTD rate
- BAL
- 57.9 No. 14
- CIN
- 52.9 No. 22
Bengals matchup lens
- Keep the offense on scheduleThe Ravens are seventh in offensive EPA/play, against Cincinnati's 15th-ranked defense. Jackson's availability and the line's health frame the offensive plan. Source
- Test Cincinnati's big-play defenseThe Ravens are third in explosive-play rate; Cincinnati ranks 32nd in explosive gains allowed at 12.8%. Sustaining drives will create more chances to exploit that opening. Source
- Finish third downsCincinnati's offense ranks ninth in EPA/play against the Ravens' 10th-ranked EPA defense. The rush needs coverage help to finish drives after Cleveland's late conversions. Source
Bengals availability watch
Tanner Hudson TEInjured Reserve
Placed on IR October 19 with a pectoral injury, removing a receiving option from the tight end rotation. SourceSwayze Bozeman LBInjured Reserve
Placed on IR October 12. Cincinnati claimed Jack Kiser as part of the same roster move. SourceAndrei Iosivas WRInjured Reserve
Remains on IR following the September 26 transaction, reducing the depth behind Cincinnati's starting receivers. Source
Numbers with context
Core Scorecard
6 regular-season games. Statuses are editorial judgments and can override the statistical rank.
Team
Team
GoodDual Eights efficiency index
Stable from Through Week 6
Current NFL positionNo. 10
The Ravens are 11th at 56.3 in the published v2.1 index through the complete Week 6 slate, down from fifth at 62.5 through Week 5. The model combines opponent-adjusted offense, defense and special teams; it measures observed efficiency rather than predicting the next game.
What this measures
The v2.1 observed-efficiency index: opponent/venue-adjusted offense and defense each carry 45%, and context-adjusted special teams carry 10%. A fixed prior-season calibration preserves performance magnitudes. Its 0–100 display scale is neither a percentile nor a win probability. Higher is better.
Source: Dual Eights v2.1 · opponent/venue adjustment + special teams
Dual Eights efficiency index: 56.3, ranked 10 of 32, stable from Through Week 6.Team
BetaDual Eights Power Index
Down 2 from No. 4 last week
Current DEPI rankNo. 6
Points relative to an average team on a neutral field: offense +2.2, defense +0.1, special teams -0.3 and quarterback +1.5. On observed play-by-play efficiency alone, the Efficiency Index has them No. 11.
What this measures
DEPI is the Dual Eights predictive power rating, expressed in points relative to an average NFL team. It blends opponent-adjusted offense, defense and special teams with the expected quarterback and carries a share of prior-season strength. The difference between two teams' ratings, plus home field (1.5 points), is the model's projected margin. Unlike the Efficiency Index, it is built to forecast games rather than describe them. Higher is better. All 32 teams →
Source: Dual Eights Power Index (beta) through Week 6 from nflverse play-by-play
Dual Eights Power Index: 3.4 points, ranked 6 of 32.Team
GoodPoint differential
Stable from Through Week 6
Current NFL positionNo. 8
The three-point loss reduces the season margin to +24, eighth in the league.
What this measures
Regular-season points scored minus points allowed. Higher is better.
Source: nflverse schedules
Point differential: +24, ranked 8 of 32, stable from Through Week 6.Team
AverageTurnover differential
Stable from Through Week 6
Current NFL positionNo. 13
The Ravens are +2, 13th. Henry's fourth-quarter fumble was the only turnover in Cleveland.
What this measures
Takeaways minus giveaways on non-deleted regular-season plays. Higher is better.
Source: nflverse play-by-play
Turnover differential: +2, ranked 13 of 32, stable from Through Week 6.Offense
Offense
GoodOffensive EPA per play
Stable from Through Week 6
Current NFL positionNo. 7
The offense is seventh at 0.12 EPA/play through six games. Cleveland held the Ravens to -0.07 per eligible play.
What this measures
Average expected points added on eligible offensive runs and passes. Higher is better.
Source: nflverse play-by-play
Offensive EPA per play: 0.12, ranked 7 of 32, stable from Through Week 6.Offense
GoodOffensive success rate
Stable from Through Week 6
Current NFL positionNo. 5
The season success rate is 48.0%, fifth. Only 33.9% of eligible Ravens plays succeeded in Cleveland.
What this measures
Share of eligible offensive plays with positive expected points added. Higher is better.
Source: nflverse play-by-play
Offensive success rate: 48.0%, ranked 5 of 32, stable from Through Week 6.Offense
EliteExplosive-play rate
Stable from Through Week 6
Current NFL positionNo. 3
The Ravens remain third in explosive-play rate at 12.8%, despite the offense's stalled possessions in Week 6.
What this measures
Share of eligible plays gaining at least 10 yards on a run or 20 yards on a pass. Higher is better.
Source: nflverse play-by-play
Explosive-play rate: 12.8%, ranked 3 of 32, stable from Through Week 6.Offense
GoodRed-zone touchdown rate
Stable from Through Week 6
Current NFL positionNo. 7
The Ravens have scored touchdowns on 71.4% of qualifying red-zone drives, seventh. Cuevas supplied the only touchdown in Cleveland.
What this measures
Share of offensive drives reaching the opponent 20-yard line that produce a touchdown. Higher is better.
Source: nflverse play-by-play
Red-zone touchdown rate: 71.4%, ranked 7 of 32, stable from Through Week 6.Defense
Defense
GoodDefensive EPA allowed per play
Stable from Through Week 6
Current NFL positionNo. 10
Season EPA allowed improves to -0.04, 10th. The Browns finished at -0.12 per eligible play despite winning the game.
What this measures
Average expected points added by opponents on eligible runs and passes. Lower is better.
Source: nflverse play-by-play
Defensive EPA allowed per play: -0.04, ranked 10 of 32, stable from Through Week 6.Defense
GoodOpponent success rate
Stable from Through Week 6
Current NFL positionNo. 7
Opponent success is 41.3%, seventh. Cleveland succeeded on 43.3% of eligible plays, with late third-down conversions making the difference.
What this measures
Share of eligible opponent plays with positive expected points added. Lower is better.
Source: nflverse play-by-play
Opponent success rate: 41.3%, ranked 7 of 32, stable from Through Week 6.Defense
GoodExplosive-play rate allowed
Stable from Through Week 6
Current NFL positionNo. 10
The season rate improves to 8.2%, 10th. Jeudy's late 33-yard catch nevertheless set up the winning field goal.
What this measures
Share of opponent plays gaining at least 10 yards on a run or 20 yards on a pass. Lower is better.
Source: nflverse play-by-play
Explosive-play rate allowed: 8.2%, ranked 10 of 32, stable from Through Week 6.Defense
AverageOpponent red-zone touchdown rate
Stable from Through Week 6
Current NFL positionNo. 14
Opponents have converted 57.9% of qualifying red-zone drives into touchdowns, 14th. Cleveland's short-field touchdown followed Henry's fumble.
What this measures
Share of opponent drives reaching the Ravens' 20-yard line that produce a touchdown. Lower is better.
Source: nflverse play-by-play
Opponent red-zone touchdown rate: 57.9%, ranked 14 of 32, stable from Through Week 6.Film and role evaluation
Unit Report Card
Quarterback
Strength ↓
- Season through Week 6
- B+
- Week 6 at Cleveland
- D
- NFL NGS · Through Week 7
- Jackson CPOE +7.1% No. 2 QB
- ESPN · Through Week 7
- Jackson QBR 81.9 No. 2 NFL
Week 6: Huntley completed 19 of 31 passes for 165 yards and a touchdown without an interception, but only two completions gained 12 or more yards and the offense failed to score after its first two drives. Jackson's season QBR and CPOE are separate analytics, not grades for Huntley's performance.
Read related analysis →Running backs
Solid ↓
- Season through Week 6
- B
- Week 6 at Cleveland
- D
- NFL NGS · Through Week 7
- Henry RYOE/att +0.09 No. 17 RB
Week 6: Henry managed 58 yards on 17 carries, and his fourth-quarter fumble set up Cleveland's tying touchdown. The Ravens averaged -0.56 EPA per designed run.
Wide receivers
Strength ↓
- Season through Week 6
- A-
- Week 6 at Cleveland
- B
- SumerSports · Updated Oct. 23, 2026
- Flowers YPRR 3.77 No. 1 WR
- 125 routes · Min. 60 for BAL (10/team game)
- NFL NGS · Through Week 7
- Flowers YACOE +2.03 No. 6 WR
Week 6: Flowers caught six passes for 66 yards and Lane returned with four for 40. Bateman left in the second quarter with a shoulder injury. Flowers' season yards per route run and YAC over expectation provide additional receiving context.
Tight ends
Solid ↓
- Season through Week 6
- B-
- Week 6 at Cleveland
- C
- NFL NGS · Through Week 7
- Andrews YACOE -0.18 No. 22 TE
Week 6: Cuevas caught four passes for 44 yards and his first NFL touchdown, including a 29-yard gain from a guard-like alignment, but the blocking did not sustain the run game after the opening drives.
Offensive line
Mixed ↓
- Season through Week 6
- C+
- Week 6 at Cleveland
- C-
- ESPN · Through Week 6
- Team PBWR 47% No. 20 NFL
- ESPN · Through Week 6
- Team RBWR 73% No. 19 NFL
Week 6 grade: Cleveland's aggressive upfield front held the Ravens to 87 rushing yards at 3.8 per carry. Jones struggled and Ioane had more snap issues in his third straight start at center. The separate analytics use ESPN's Week 6 rates and Filmstudy's published reports through Week 6.
Ravens O-line rankings · Filmstudy
Filmstudy · Ken McKusick · Written reports through Week 6 · Published Oct 20
| Rank | Lineman | Aggregate grade |
|---|---|---|
| 1 | Carson Vinson | B |
| 2 | Vega Ioane | C+ |
| 3 | Roger Rosengarten | C+ |
| 4 | John Simpson | C |
| 5 | Ronnie Stanley | C- |
| 6 | Emery Jones Jr. | D+ |
| 7 | Jovaughn Gwyn | D+ |
| 8 | Andrew Vorhees | F |
Dual Eights aggregation: each published Filmstudy adjusted game letter grade is converted to a standard grade-point scale, weighted by the player's scored snaps, then rounded to the nearest letter grade. Ranks compare Ravens linemen only, with at least 20 graded snaps. Only explicitly published grades count; missing appearances are not estimated.
Below the minimum: Ethan Pocic (9 scored snaps).
Reports: Week 1 · Week 2 · Week 3 · Week 4 · Week 5 · Week 6. Later weeks appear when written scoring is published.
Defensive line
Strength ↑
- Season through Week 6
- A-
- Week 6 at Cleveland
- A
- ESPN · Through Week 6
- Team RSWR 31% No. 9 NFL
- ESPN · Through Week 6
- Campbell PRWR 16% No. 18 DT
Week 6 grade: Madubuike recorded his first sack in more than a year and Campbell added another, while Cleveland ran 29 times for 93 yards. The separate ESPN run-stop and player rush metrics include Week 6.
Edge rushers
Solid →
- Season through Week 6
- B
- Week 6 at Cleveland
- B
- ESPN · Through Week 6
- Team PRWR 53% No. 10 NFL
- ESPN · Through Week 6
- Hendrickson PRWR 30% No. 3 EDGE
Week 6 grade: Hendrickson returned from a finger procedure with a sack and multiple pressures as the Ravens sacked Watson five times. The separate ESPN rush metrics include that game.
Linebackers
Solid ↓
- Season through Week 6
- B
- Week 6 at Cleveland
- C+
Week 6: Cleveland converted one of its first 10 third downs, then four of its final six, including the 33-yard completion that set up the winning field goal. No defensible free league-wide linebacker metric is added.
Secondary
Solid ↑
- Season through Week 6
- B
- Week 6 at Cleveland
- B+
- nflverse · Through Week 7
- Opp. CPOE +0.7% No. 17 NFL
Week 6: Hamilton made three tackles for loss and Martin added a sack and several strong coverage snaps, though his late pass interference and offside penalties extended Cleveland drives. Watson threw for 164 yards. Opponent CPOE is a separate season metric.
Specialists
Solid ↓
- Season through Week 6
- B
- Week 6 at Cleveland
- D
Week 6: Loop missed a 49-yard field goal that would have restored a 10-point fourth-quarter lead, after making a 34-yarder on the second drive.
Recent form
Recent Results
Last five: 3-2 · Point differential: +6
-
Week 6 · at Cleveland Browns
L 10–13 The Ravens lost to the Cleveland Browns 10–13. -
Week 5 · at Atlanta Falcons
W 30–23 The Ravens defeated the Atlanta Falcons 30–23. -
Week 4 · vs. Tennessee Titans
W 24–18 The Ravens defeated the Tennessee Titans 24–18. -
Week 3 · at Dallas Cowboys
W 34–31 The Ravens defeated the Dallas Cowboys 34–31. -
Week 2 · vs. New Orleans Saints
L 17–24 The Ravens lost to the New Orleans Saints 17–24.
Material absences only
Injuries & Availability
Week 7 vs. Cincinnati · Thursday, October 22
Practice participation, not final game designations. Jurgens is out of concussion protocol and practiced fully twice. Bateman, Stanley, Vorhees, Ioane and Hibner were full Thursday; their old absence flags are removed. Robinson and Hawkins missed Thursday. Tampa remains on IR pending activation.
Lamar Jackson QB
LimitedBoth Jackson and Huntley are preparing with the first team.
Availability: Limited Wednesday and Thursday. No starter or final game designation announced.
Source: Ravens official Thursday injury report · Oct. 22Tavius Robinson EDGE
MonitoringHis absence would reduce the edge rotation alongside Hendrickson.
Availability: DNP Wednesday and Thursday. Friday's designation is pending; not yet ruled out.
Source: Ravens official Thursday injury report · Oct. 22Jaylinn Hawkins S
MonitoringThe safety rotation may need to adjust against Cincinnati's passing attack.
Availability: Limited Wednesday, DNP Thursday. Friday's designation is pending.
Source: Ravens official Thursday injury report · Oct. 22Broderick Washington DL
LimitedInterior depth remains an availability watch.
Availability: Limited in both practices after missing Week 6. No final Cincinnati designation yet.
Source: Ravens official Thursday injury report · Oct. 22T.J. Tampa CB
ReturningCould restore outside-corner and special-teams depth.
Availability: Return-to-practice window opened October 21; limited Wednesday and Thursday. Remains on IR and must be activated before playing.
Source: Ravens return-to-practice announcement / Thursday reportDurham Smythe TE
Injured ReserveVannett joined the active roster; Hibner and Cuevas may also take larger blocking roles.
Availability: Placed on IR October 7 and out for the remainder of the season.
Source: Ravens roster announcement · Oct. 7Danny Pinter C
Injured ReserveOne of three injured centers behind the move for Jurgens.
Availability: Remains on IR after his preseason knee injury.
Source: Ravens center trade report · Oct. 7Jovaughn Gwyn C
Injured ReserveUnavailable as the Ravens rebuild their center depth.
Availability: Remains on the official IR roster after the October 3 transaction.
Source: Ravens roster · checked Oct. 22Ethan Pocic C
Injured ReserveThe veteran remains unavailable behind Ioane and Jurgens.
Availability: Remains on the official IR roster after the October 3 transaction.
Source: Ravens roster · checked Oct. 22Bilhal Kone CB
Injured ReserveNot yet available as additional cornerback depth.
Availability: Listed as Reserve/Injured; Designated for Return. That roster category does not confirm activation or a new practice window.
Source: Ravens roster · checked Oct. 22Adam Randall RB
Injured ReserveThe rookie remains outside the available backfield rotation.
Availability: Listed as Reserve/Injured; Designated for Return. No activation has been announced.
Source: Ravens roster · checked Oct. 22Go deeper
Latest Ravens Analysis
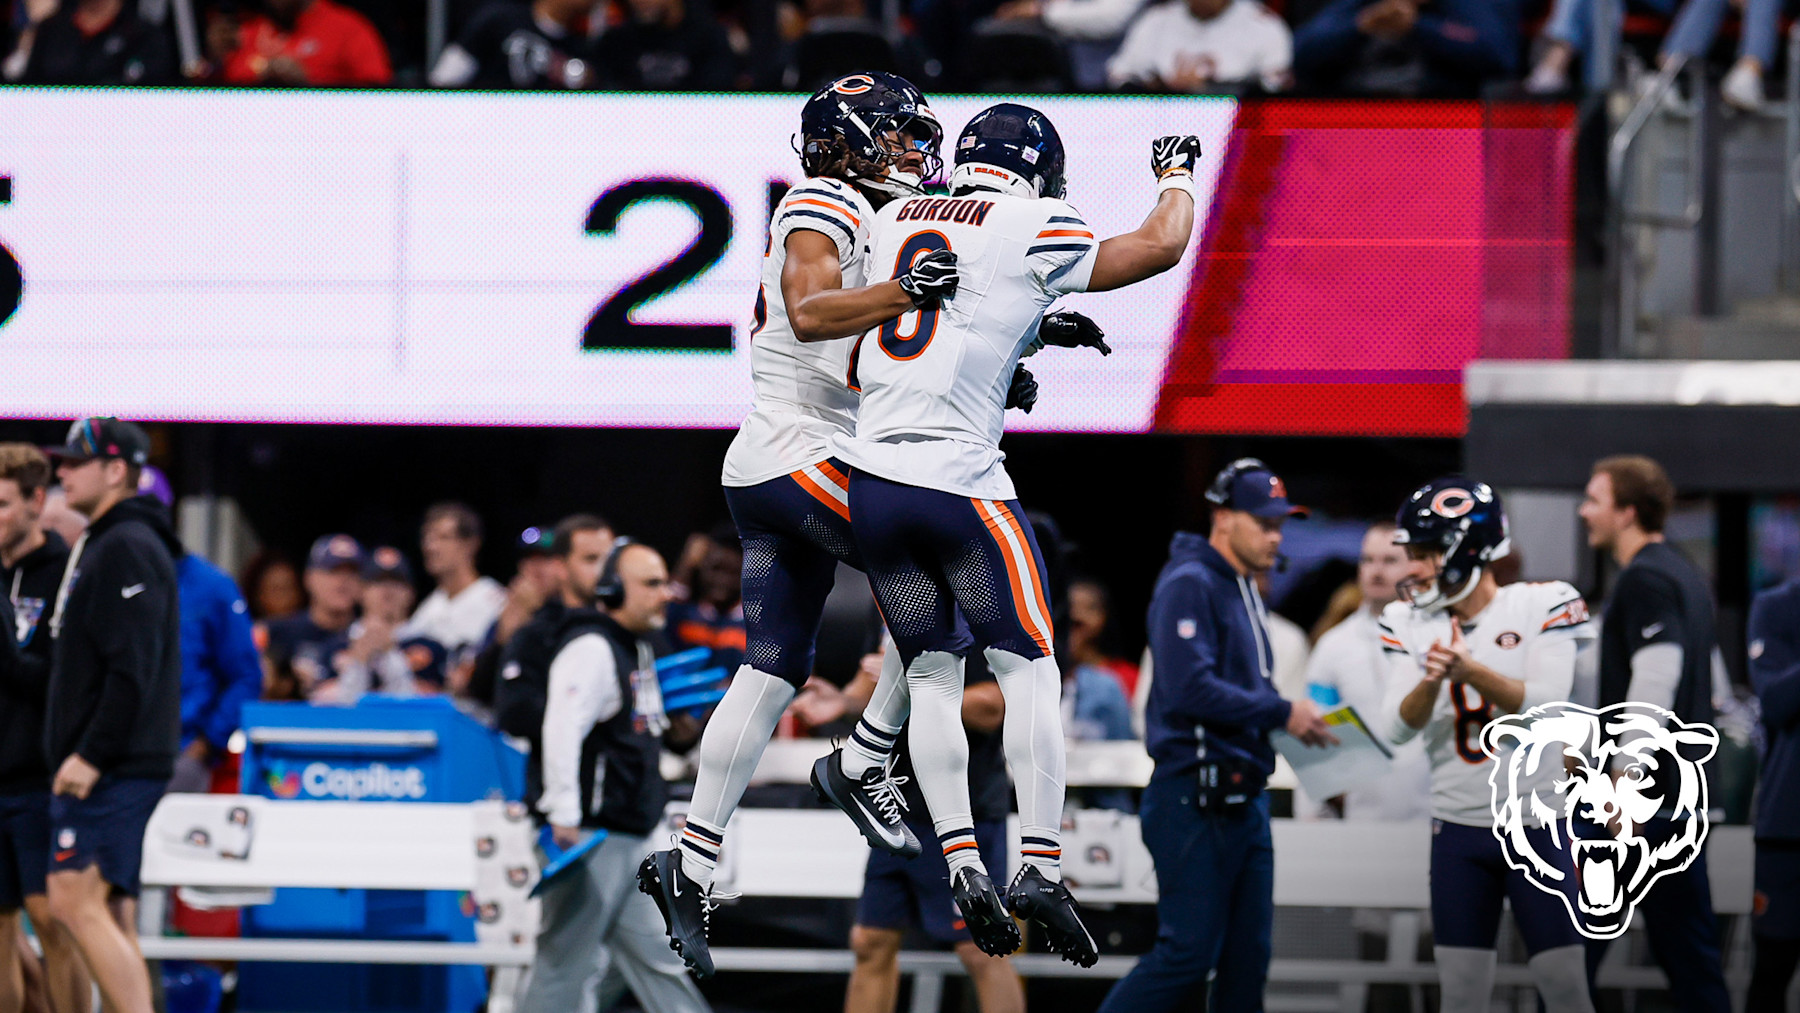
Dual Eights Efficiency Index
Dual Eights Efficiency Index: Bears Surge, Ravens Slide, and the 49ers Extend Their Lead
The Bears surge to fourth, the Ravens slide out of the top 10, and the 49ers extend their lead. Week...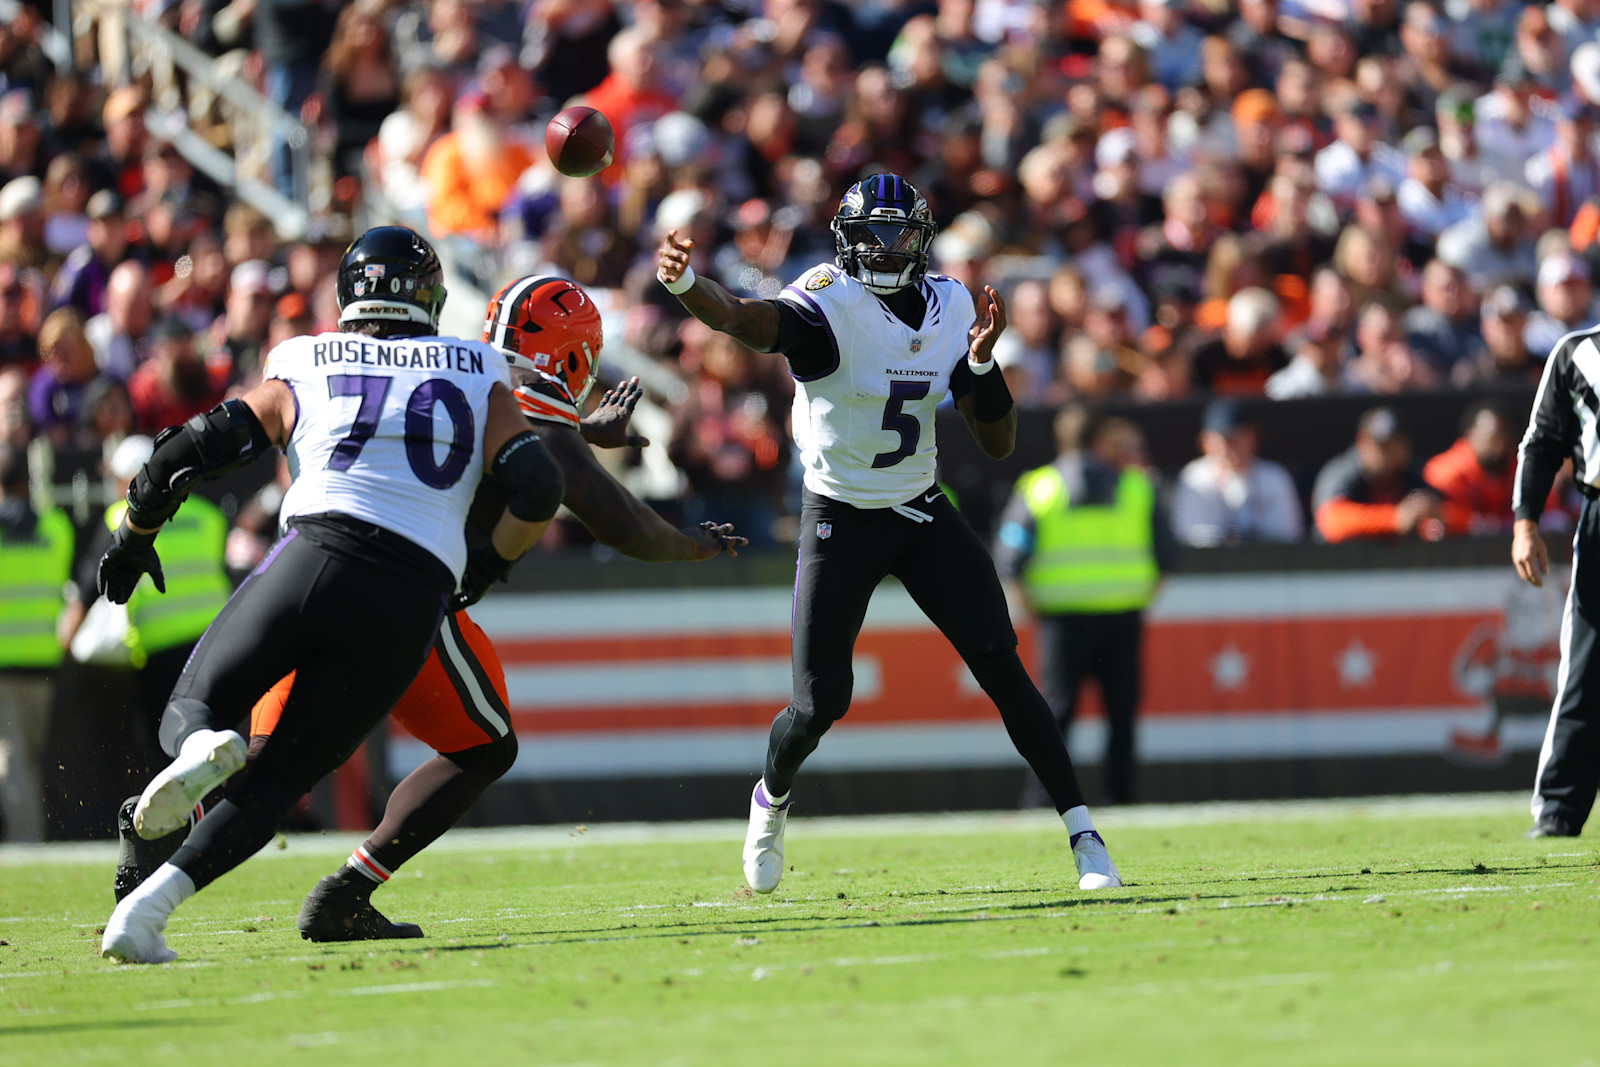
First and Five
First and Five: The Offense Left the Defense No Chance
The Ravens scored on their first two drives, then went silent in a 13-10 loss to Cleveland. Five takeaways on...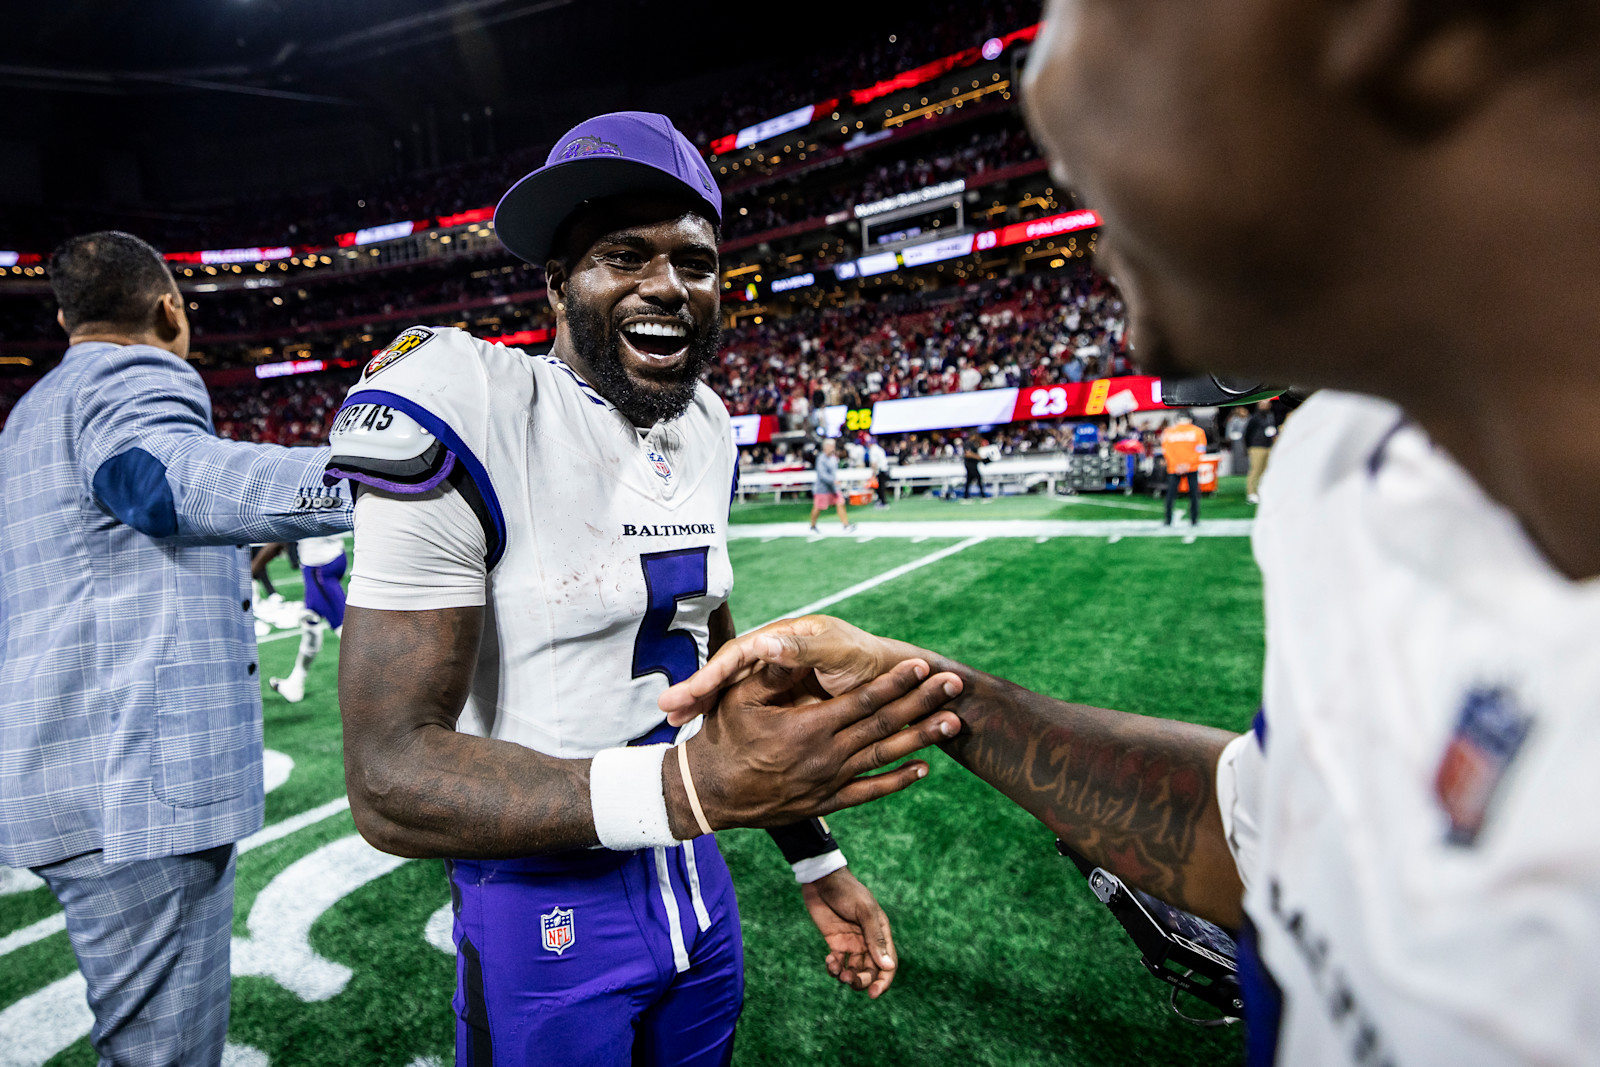
First and Five
First and Five: Somehow, the Ravens Found a Way
The Ravens found a way to beat Atlanta 30-23 in overtime without Lamar Jackson. Huntley delivered late, Doyle got creative,...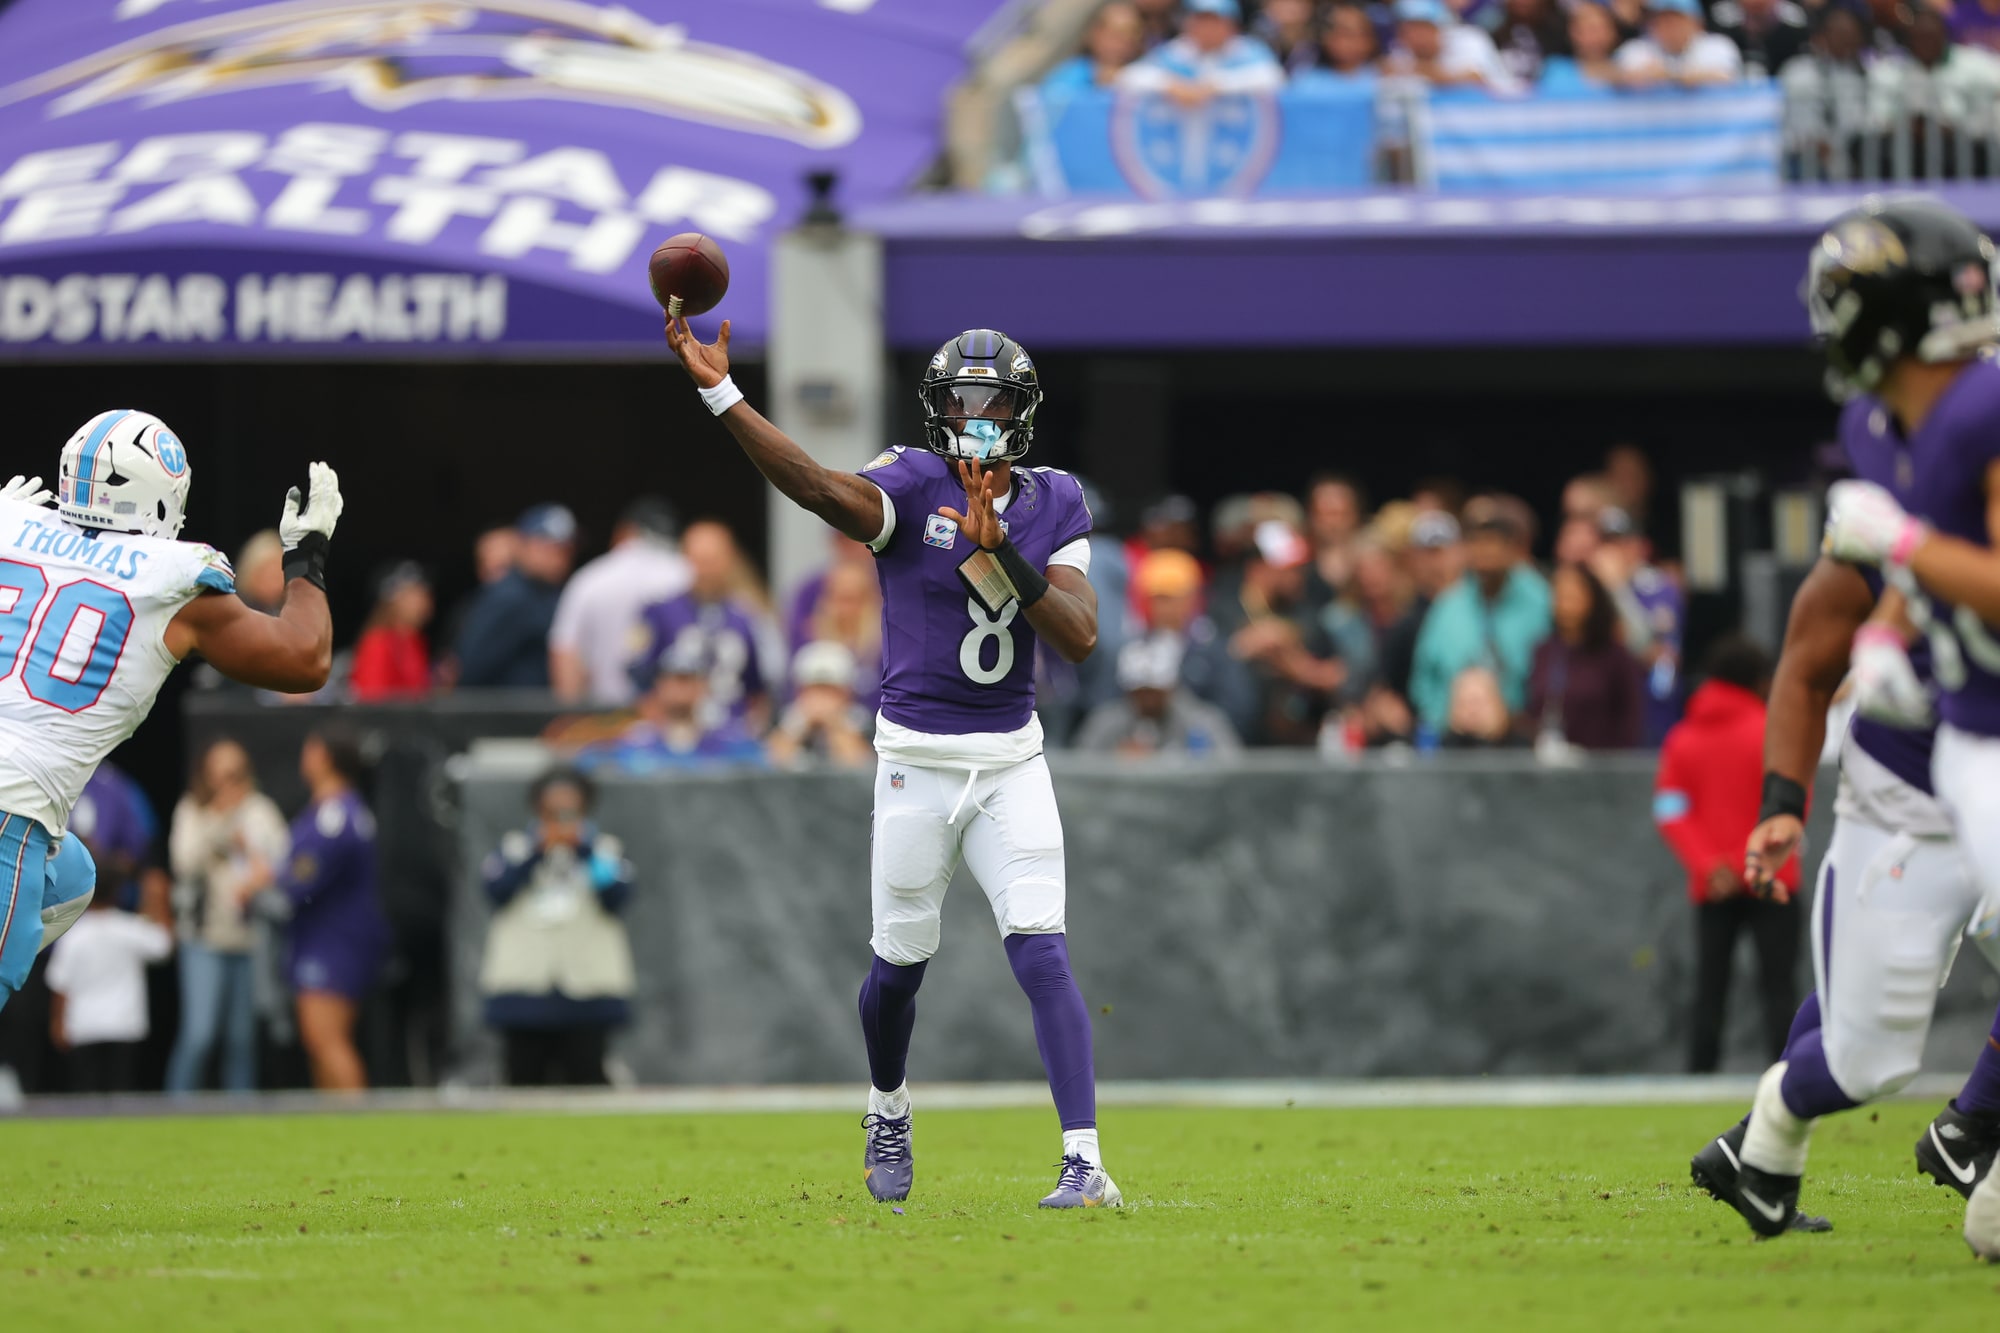
First and Five
First and Five: Ravens Take Care of Business, Now We Hold Our Breath
The Ravens beat the Titans 24-18 to reach 3-1, but Lamar Jackson’s ankle injury overshadowed Loop’s record kick, Ioane’s first...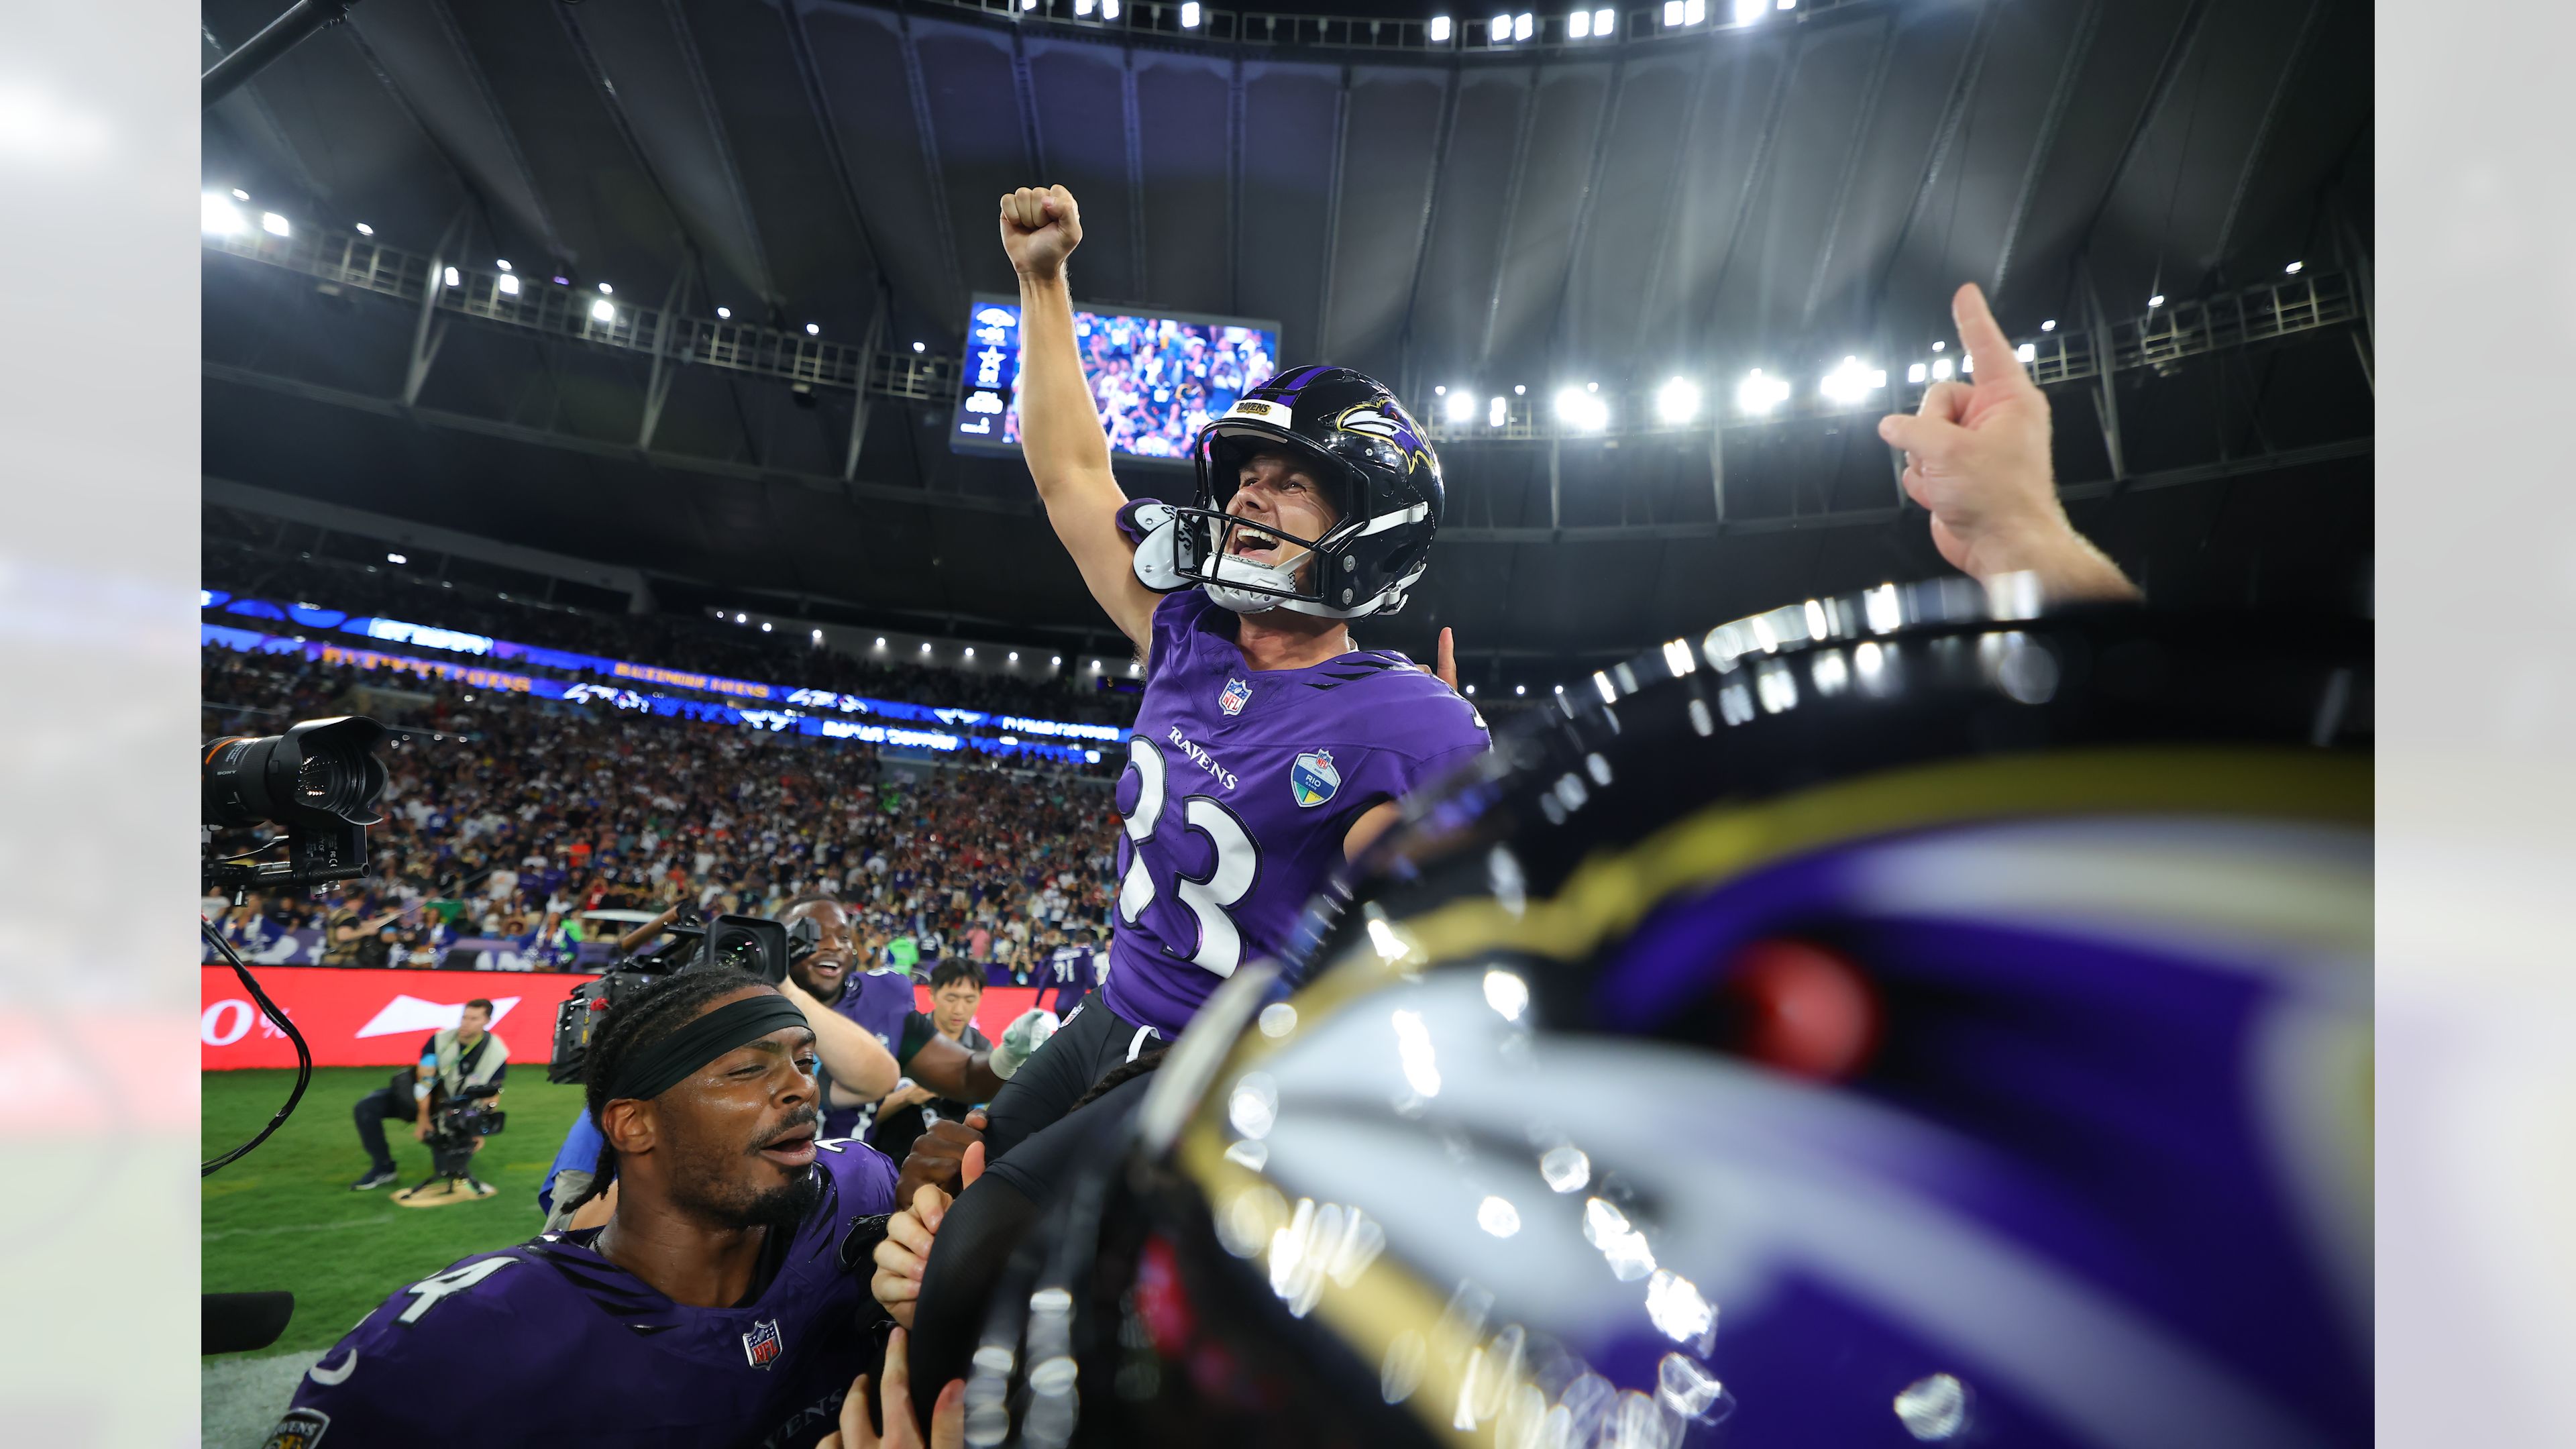
First and Five
First and Five: Tyler Loop Delivers When It Matters
Tyler Loop's 56-yard winner in Rio gave the Ravens a needed finish, even as tackling and short-yardage issues remain unresolved....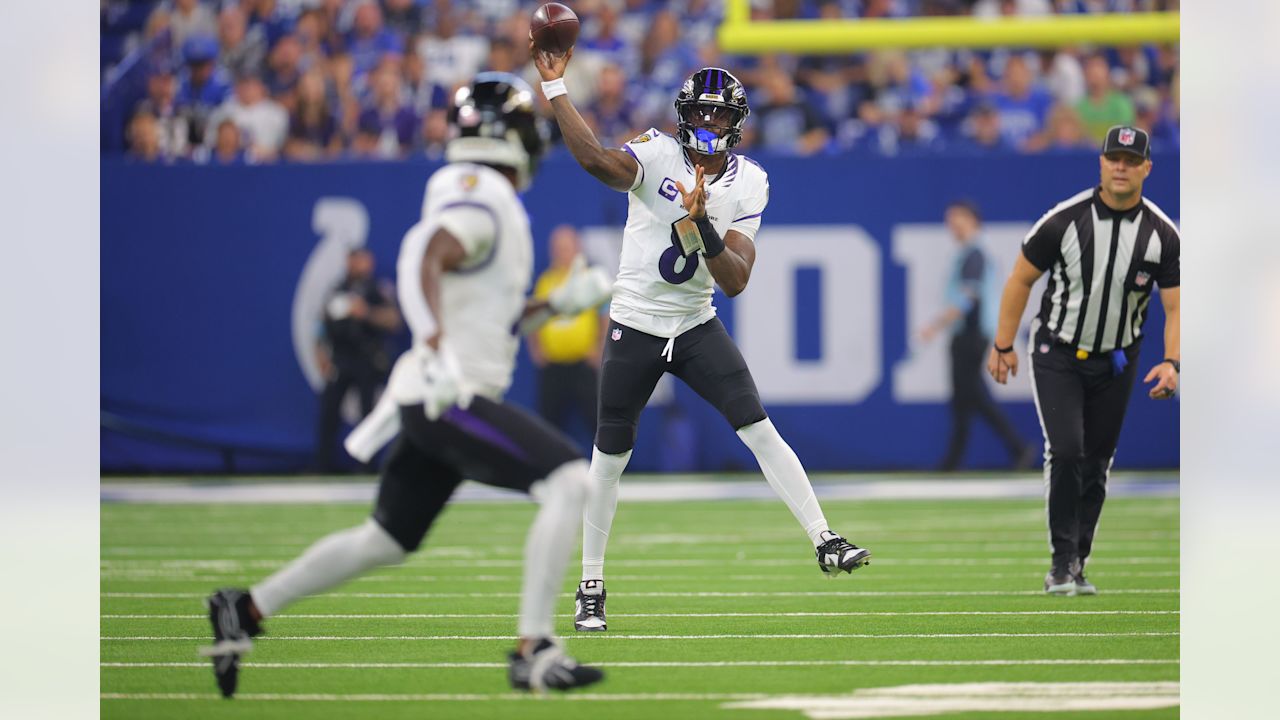
First and Five
First and Five: This Is Gonna Be Fun
Baltimore’s 41-23 opener in Indianapolis supplied a reminder of what a healthy Lamar Jackson, Derrick Henry and an explosive new...
NFL playoff predictions
NFL Season Predictions
Baltimore and Detroit earn the No. 1 seeds, Buffalo breaks through the AFC and the Lions finish the job in...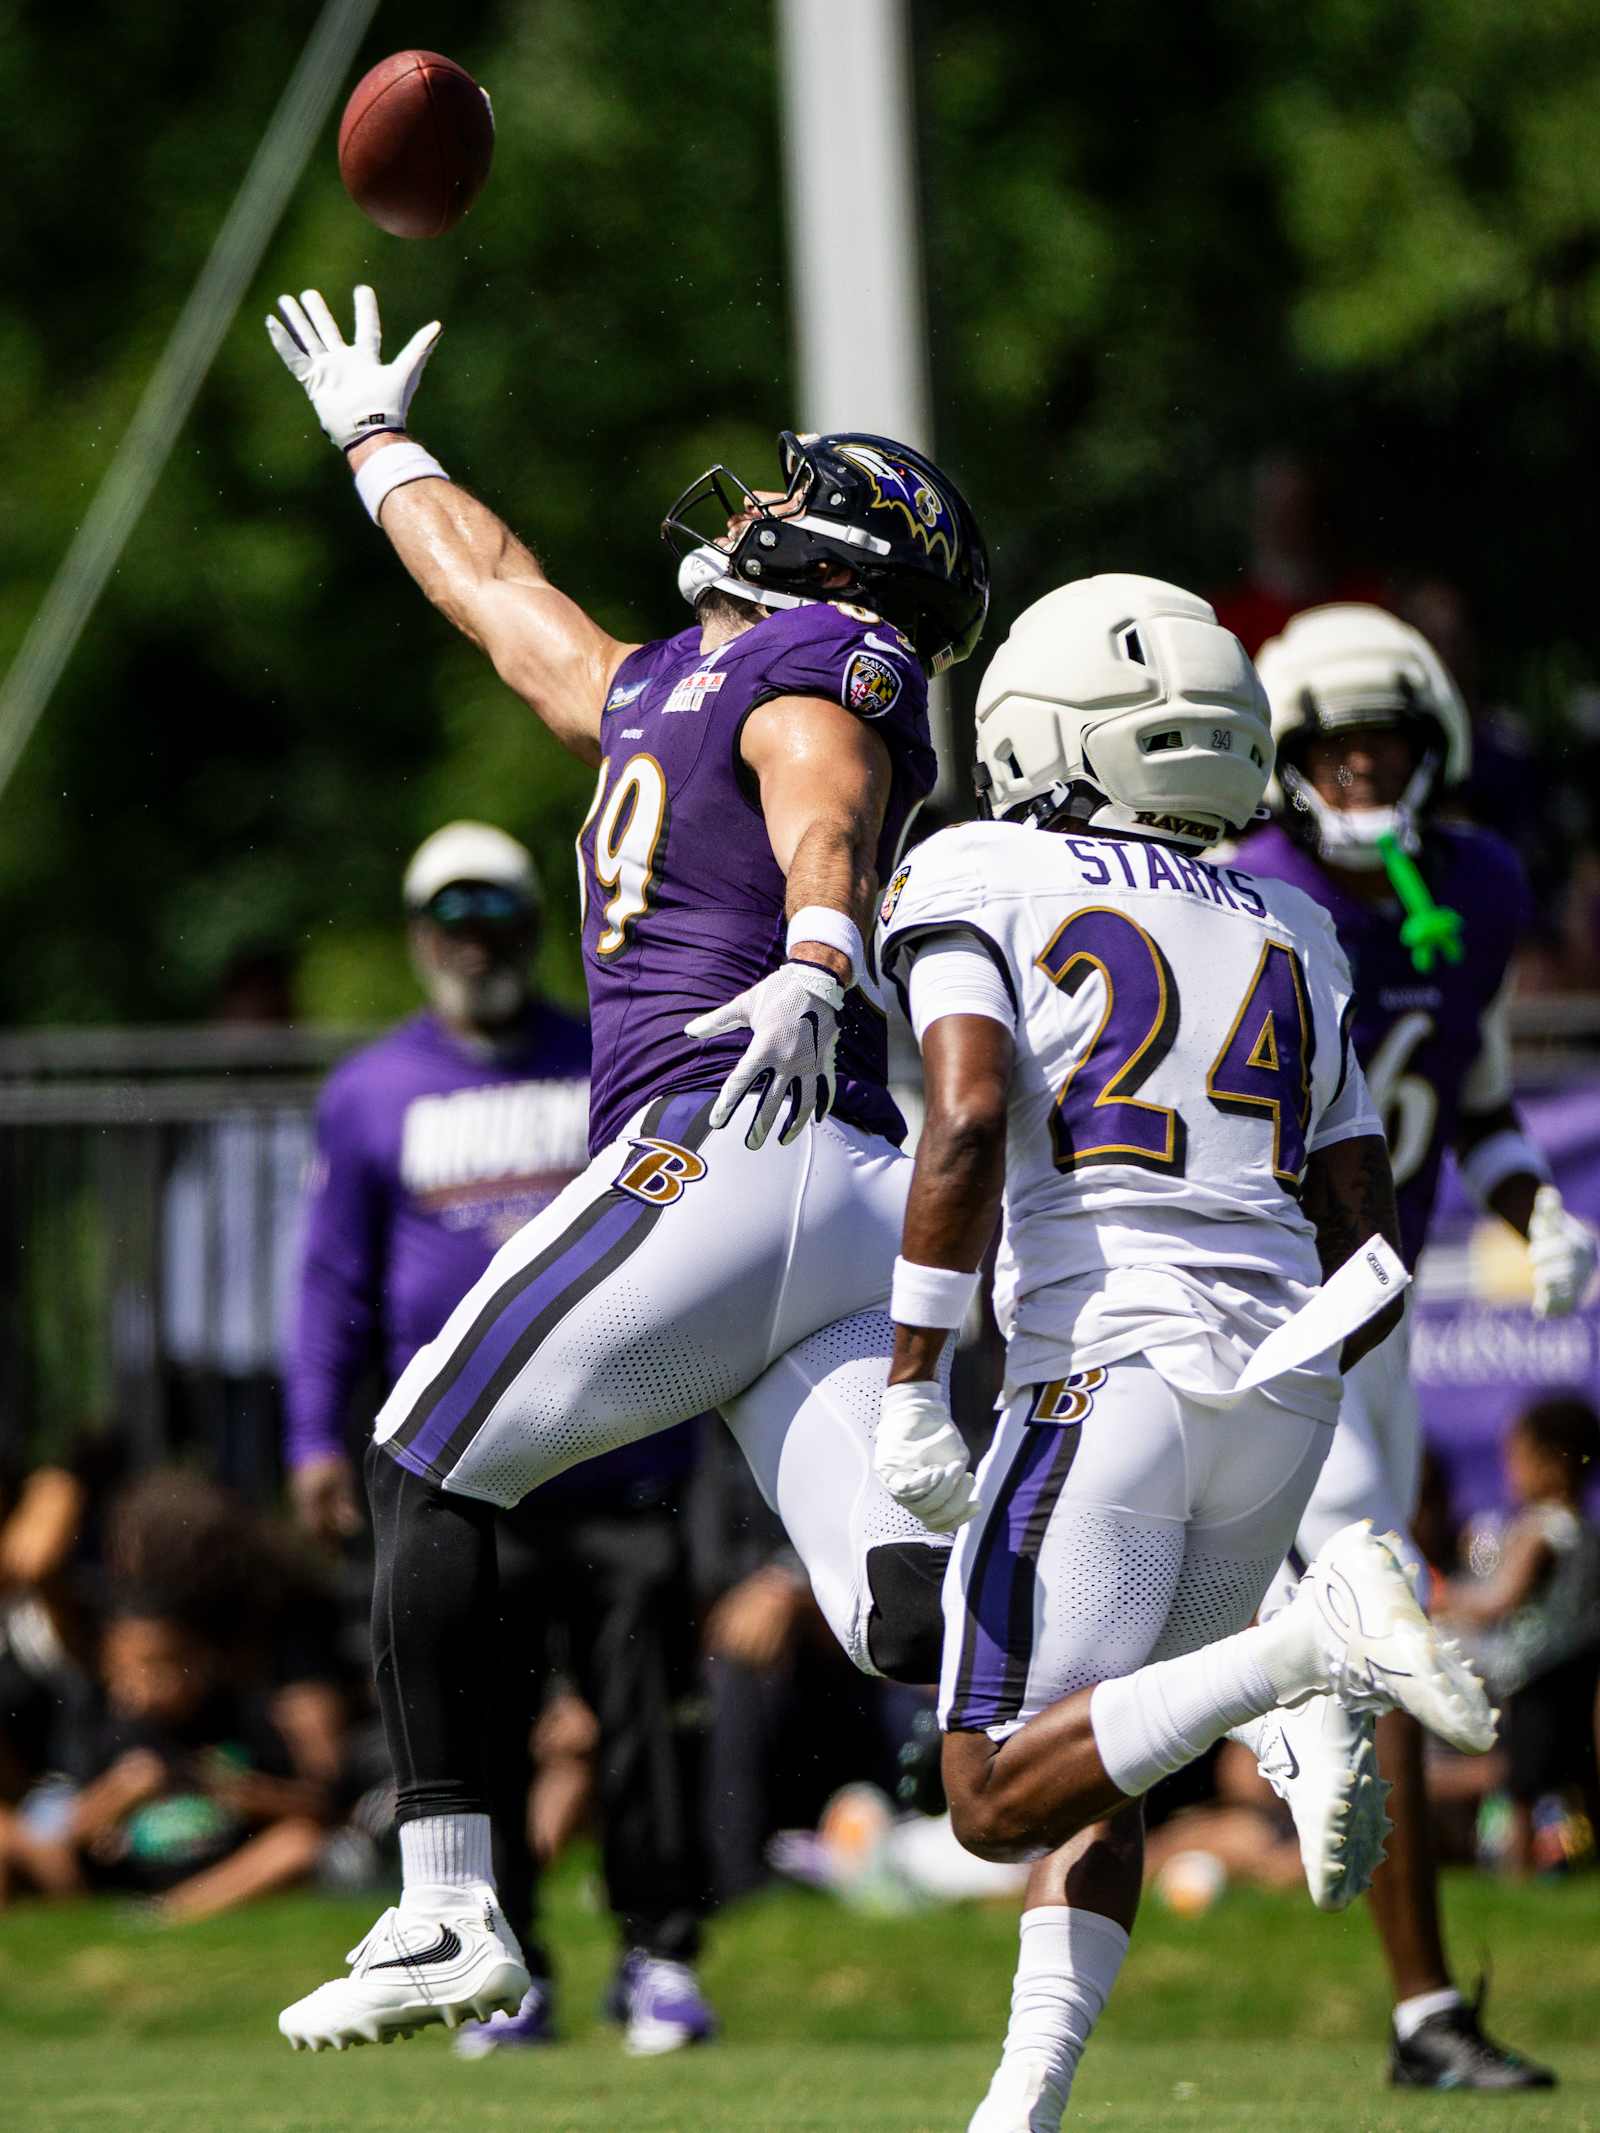
Ravens 2026 season preview
Five Players and One Coach Who Will Determine the Ravens’ Ceiling
Baltimore’s stars make it a contender. Its championship ceiling depends on six less certain answers, from Nnamdi Madubuike’s return to...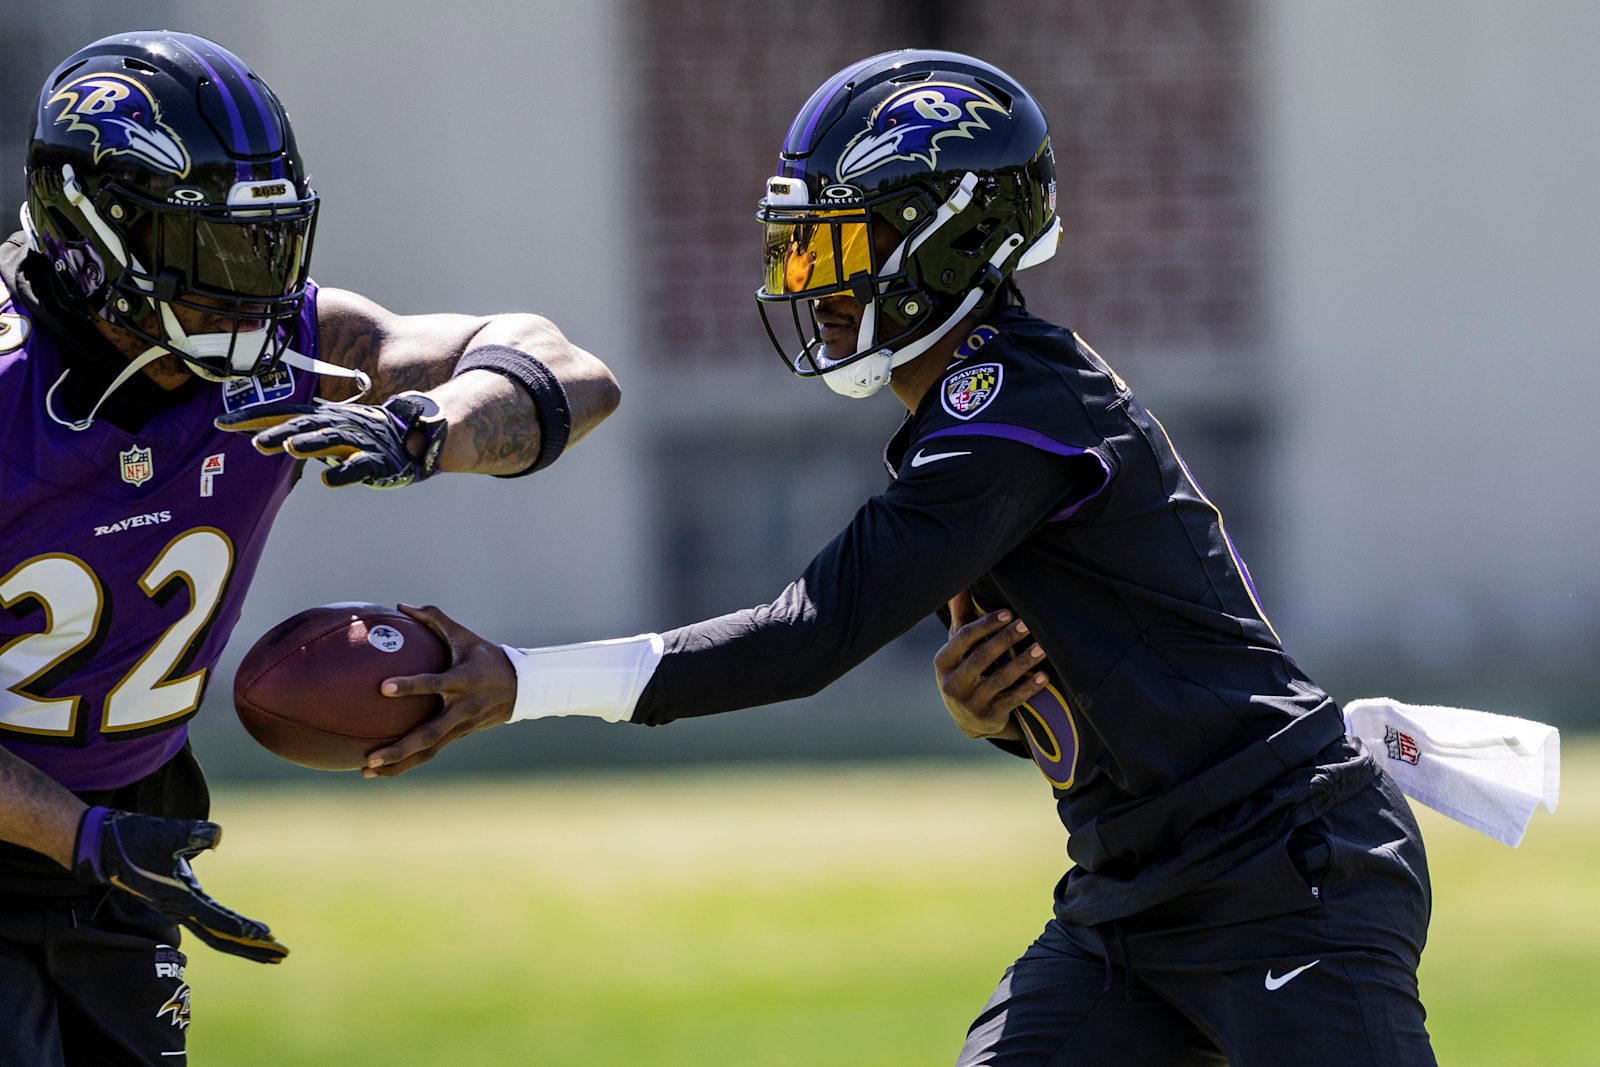
Ravens 2026 season preview
Five Very Specific Predictions for the Ravens Season
A 5-1 start, four sacks and four takeaways for Kyle Hamilton, Lamar Jackson's highest play-action rate and a meaningful improvement...Plain-language reference
Metric Glossary & Sources
Efficiency index
The v2.1 observed-efficiency index: opponent/venue-adjusted offense and defense each carry 45%, and context-adjusted special teams carry 10%. A fixed prior-season calibration preserves performance magnitudes. Its 0–100 display scale is neither a percentile nor a win probability. Higher is better.
Point diff.
Regular-season points scored minus points allowed. Higher is better.
Turnover diff.
Takeaways minus giveaways on non-deleted regular-season plays. Higher is better.
EPA / play
Average expected points added on eligible offensive runs and passes. Higher is better.
Success rate
Share of eligible offensive plays with positive expected points added. Higher is better.
Explosive rate
Share of eligible plays gaining at least 10 yards on a run or 20 yards on a pass. Higher is better.
Red-zone TD rate
Share of offensive drives reaching the opponent 20-yard line that produce a touchdown. Higher is better.
EPA allowed / play
Average expected points added by opponents on eligible runs and passes. Lower is better.
Success allowed
Share of eligible opponent plays with positive expected points added. Lower is better.
Explosives allowed
Share of opponent plays gaining at least 10 yards on a run or 20 yards on a pass. Lower is better.
Opponent RZ TD rate
Share of opponent drives reaching the Ravens' 20-yard line that produce a touchdown. Lower is better.
nflverse schedules and play-by-play
Automated regular-season results, EPA, success, explosive plays, red-zone drives and NFL ranks
Schedules update about every five minutes; play-by-play is refreshed nightly after game days. · CC BY 4.0NFL Next Gen Stats via nflverse
Automated CPOE, RYOE per attempt and YAC over expectation values and qualifying-player ranks for the Unit Report Card
Current-season player summaries update nightly when players meet NFL Next Gen Stats minimums.ESPN Total QBR
Automated Lamar Jackson Total QBR and qualified league rank for the Unit Report Card
Checked nightly; the last good value is retained if ESPN is temporarily unavailable.ESPN Analytics Win Rate Rankings
Automated team and Ravens player PRWR, RSWR, PBWR and RBWR context for the Unit Report Card
Checked by the daily dashboard update; the last good value is retained if ESPN is temporarily unavailable.Filmstudy · Ken McKusick
Published Ravens offensive-line adjusted game letter grades, aggregated by Dual Eights using scored-snap weights
Written scoring reports checked daily; the last good aggregation is retained if unavailable, incomplete or older than the stored reporting week.SumerSports
Flowers yards per route run and league WR rank; qualification requires 10 routes per completed team game
Public season table checked daily; the source date and route sample are shown, and the last good value is retained if the feed is unavailable.Baltimore Ravens official schedule
2026 schedule and official preseason results
As published by the clubBaltimore Ravens official news and roster reports
Availability, roster status and dated team context
Reviewed for each dashboard update- The current Dual Eights Efficiency Index uses the published v2.1 formula: 45% opponent/venue-adjusted offense, 45% adjusted defense and 10% context-adjusted special teams. Dropbacks and designed runs are fitted separately, with reduced fourth-quarter weight in extreme game states and a fixed 2025 calibration. The display transform is 50 + 50 × tanh(composite / 2); it is not a percentile or a win probability.
- The raw EPA, success, explosive-play and red-zone scorecard statistics remain unweighted. Archived Week 1–3 index snapshots retain the original percentile formula; Week 4's published v2.1 value supplies the same-scale comparison for Week 5. Archived article text is unchanged.
- Only regular-season plays count toward the ranked scorecard. Kneels, spikes, two-point attempts, deleted plays and aborted plays are excluded.
- Explosive plays are runs of 10+ yards or passes of 20+ yards, divided by eligible run/pass plays.
- Red-zone rates are drive-level: a drive qualifies once it reaches the opponent 20-yard line.
- ESPN pass-block and pass-rush win rates measure whether the blocker sustains or the rusher defeats a block within 2.5 seconds; its run-block and run-stop rates evaluate the result of blocks on designed runs.
- NFL Next Gen Stats CPOE compares actual completion rate with expected completion rate; RYOE/att compares a runner's yards with the model's expectation per attempt; YACOE compares yards after catch with expected yards after catch.
- ESPN Total QBR values quarterback contributions on passes, rushes, sacks, turnovers and penalties on a 0–100 scale, adjusted for opponent strength. Only qualified quarterbacks are ranked.
- The secondary's opponent CPOE is calculated from nflverse play-by-play and ranked from lowest to highest because suppressing completions relative to expectation is better.
- Pressure rate is omitted because the free sources reviewed do not expose a defensible complete pressure variable.
- Playoff probability is omitted until a transparent, repeatable model is added.
- Unit letter grades are editorial, informed by role, film and results; they are separate from the statistical scorecard.
- ESPN win rates are shown as third-party evidence and are not converted directly into Dual Eights letter grades. Team ranks are among 32 teams; player ranks are within the listed ESPN position group.
- Filmstudy ranks compare Ravens linemen only. Dual Eights converts each explicitly published adjusted game letter grade to a standard grade-point scale, weights it by that game's scored snaps and rounds the average to the nearest letter grade. Players need at least 20 graded snaps; ungraded appearances do not enter the average. Delayed scoring published inside a later report is assigned to the actual game week and counted once.
The updater stores compact weekly snapshots in the repository; browsers never download the source Parquet files. Availability and editorial judgments remain separate from calculated metrics.