
| **November 18, 2026 | Through all Week 10 games** |
Jacksonville is still first. The group chasing the Jaguars is getting more interesting.
After a 40–23 win at Tennessee, the Jaguars retain the lead in the Dual Eights Efficiency Index at 67.61. San Francisco is 1.15 points behind, followed by a Rams team whose recent results are beginning to match the strength our forward-looking model has projected for much of the season.
Los Angeles has won four straight. Its 34–6 victory at Arizona supplies the strongest improvement in this week’s Efficiency calculations. Cincinnati and Detroit are close behind after convincing wins over Pittsburgh and New England.
Those three teams now occupy third, fifth and sixth in Efficiency. In the Dual Eights Power Index, or DEPI, the Rams are second, Cincinnati fourth and Detroit fifth. San Francisco remains the projected best team, but its lead over Los Angeles is down to 0.21 points.
For Ravens fans, the news is considerably less encouraging. Baltimore lost to a previously winless Chargers team and has now dropped five straight. Its modest rise in DEPI offers some evidence of a more functional offense with Jacoby Brissett, although the underlying Efficiency ranking remains firmly in the middle of the league.
You can explore all 32 teams, change the assumed quarterback and examine injury-cluster scenarios on the NFL Rankings Dashboard.
A note on this week’s numbers
The refreshed public play-by-play feed includes revisions to EPA values from earlier games. That changes some of the season scores even before Week 10 enters the calculation. Our formulas and coefficients are the same.
The movement columns below compare with the final published Week 9 dashboard. When discussing how much a team improved or declined because of the latest week, we compare both weeks recalculated from the same refreshed data. Those calculations also update opponent estimates as games enter the sample.
This distinction matters most for Tampa Bay and Buffalo. Their published Efficiency ranks fell, but Tampa Bay was on a bye and Buffalo’s performance improved its score on consistent inputs. Detroit’s latest game produces a 3.46-point improvement on that basis, despite a lower overall score than the one published last week.
Week 10 Dual Eights Efficiency Index Top 10
| Rank | Team | Record | Index | Change | DEPI rank |
|---|---|---|---|---|---|
| 1 |  Jacksonville Jaguars | 7-2 | 67.61 | — | 6 |
| 2 |  San Francisco 49ers | 8-1 | 66.46 | ↑ 1 | 1 |
| 3 |  Los Angeles Rams | 6-4 | 63.24 | ↑ 2 | 2 |
| 4 |  Chicago Bears | 7-2 | 63.18 | ↓ 2 | 3 |
| 5 |  Cincinnati Bengals | 7-2 | 61.42 | ↑ 3 | 4 |
| 6 |  Detroit Lions | 7-2 | 59.78 | ↑ 3 | 5 |
| 7 |  Kansas City Chiefs | 7-2 | 59.24 | — | 8 |
| 8 |  Seattle Seahawks | 6-4 | 58.23 | ↑ 2 | 9 |
| 9 |  Buffalo Bills | 8-1 | 58.12 | ↓ 3 | 7 |
| 10 |  Tampa Bay Buccaneers | 3-6 | 57.68 | ↓ 6 | 11 |
Movement compares with the final Week 9 dashboard published November 15. The Rams lead Chicago by 0.06 index points; Seattle leads Buffalo by 0.11. Full precision determines the order.
The Efficiency Index combines 45% opponent- and venue-adjusted offense, 45% adjusted defense and 10% special teams. It describes season performance on a 0–100 scale. DEPI uses projected team strength, including the expected quarterback, expressed in points relative to an average team on a neutral field. The methodology page explains both models.
1. Jacksonville Jaguars — 67.61
| **7–2 | Previous: 1 | DEPI: 6** |
The Jaguars won their third straight and sixth in seven games, with Trevor Lawrence throwing for 352 yards and three touchdowns in Tennessee. Jacksonville’s offense averaged +0.206 EPA per play, while its defense allowed −0.020.
That was enough for a comfortable win, although the opponent-adjusted calculation sees a slight defensive step back. With both weeks evaluated on the same inputs, Jacksonville’s Efficiency score slips 0.11 points.
The Jaguars still have the strongest full-season Efficiency profile. DEPI is more restrained, putting them sixth at +4.77 after their projected defensive contribution falls by roughly half a point from last week’s published snapshot. A 17-point road win can strengthen a team’s record while leaving questions about its future projection. Jaguars game report.
2. San Francisco 49ers — 66.46
| **8–1 | Previous: 3 | DEPI: 1** |
San Francisco’s 46–40 win at Dallas offered a fairly complete illustration of its strengths and vulnerabilities.
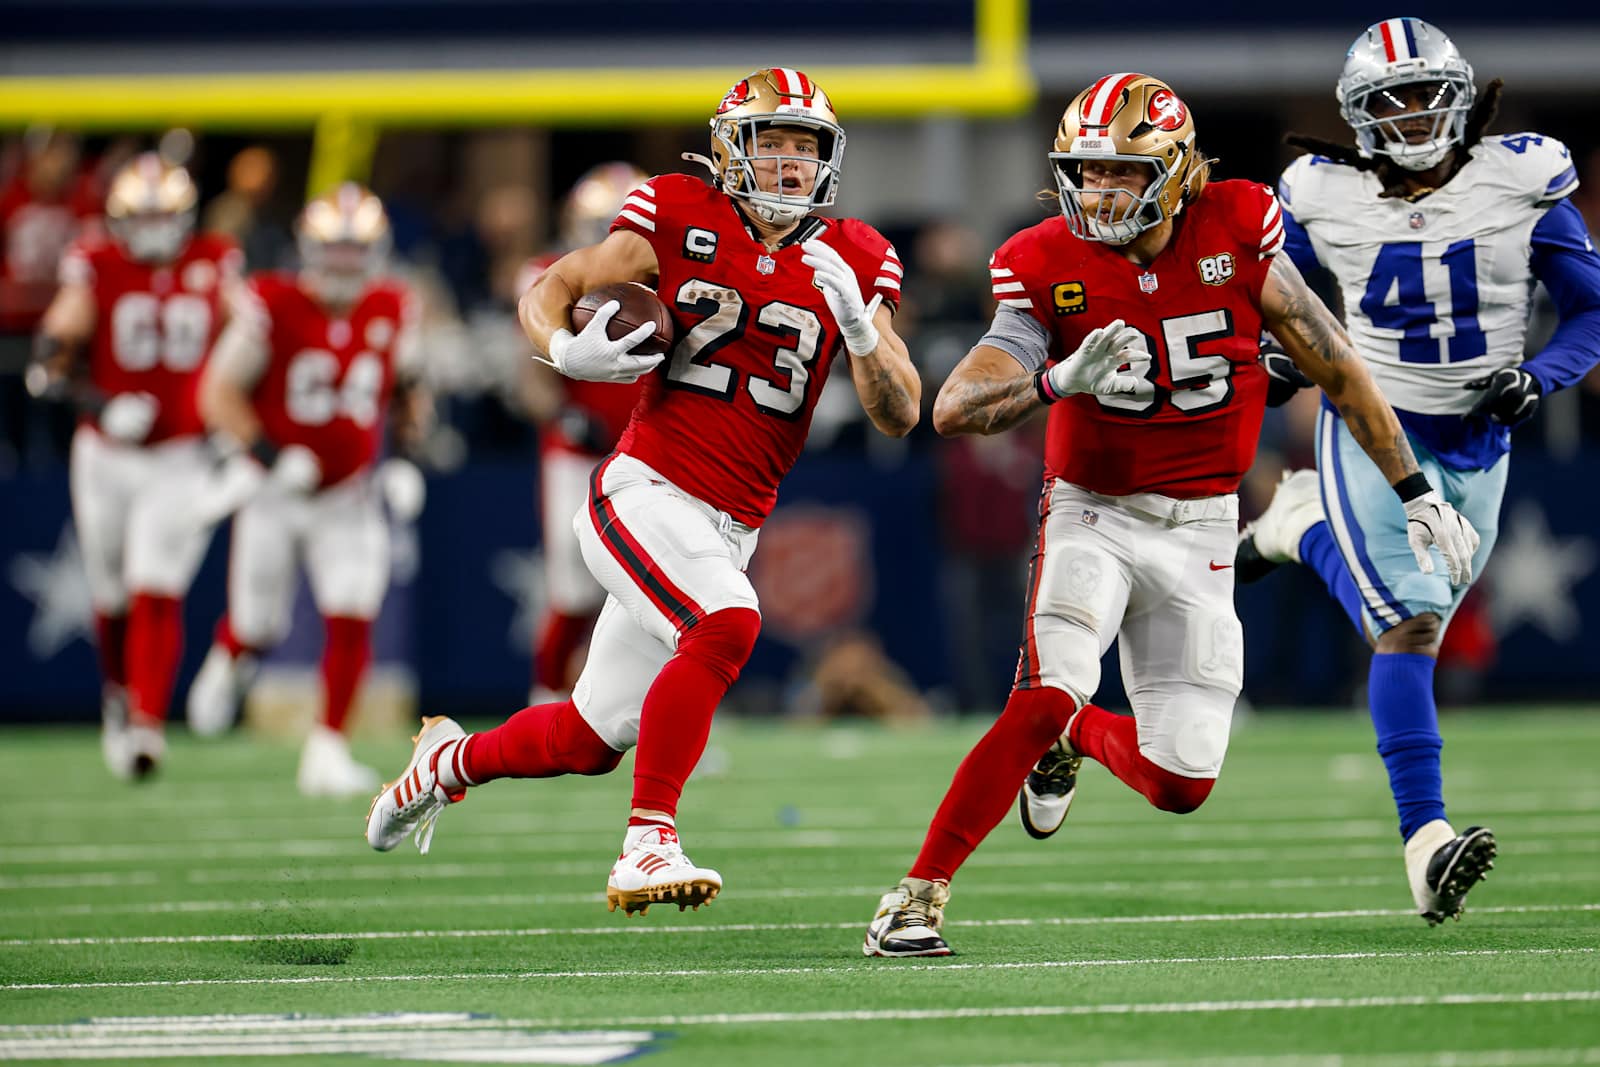
The offense generated +0.439 EPA per play. Christian McCaffrey scored three touchdowns, and Deebo Samuel’s return included a 70-yard rushing score. The defense allowed +0.196 EPA per play, leaving the 49ers dependent on their offense to keep answering.
They did, improving their consistent-input Efficiency score by 0.49 points. San Francisco remains first in DEPI at +6.76, supported by an enormous +5.91 offensive contribution. Its projected defense adds only +0.42. That imbalance makes the 49ers dangerous, but it also explains why this week’s trip to Mexico City should be interesting. 49ers takeaways.
3. Los Angeles Rams — 63.24
| **6–4 | Previous: 5 | DEPI: 2** |
The Rams have spent several weeks looking stronger in DEPI than in the standings. Their results are catching up.
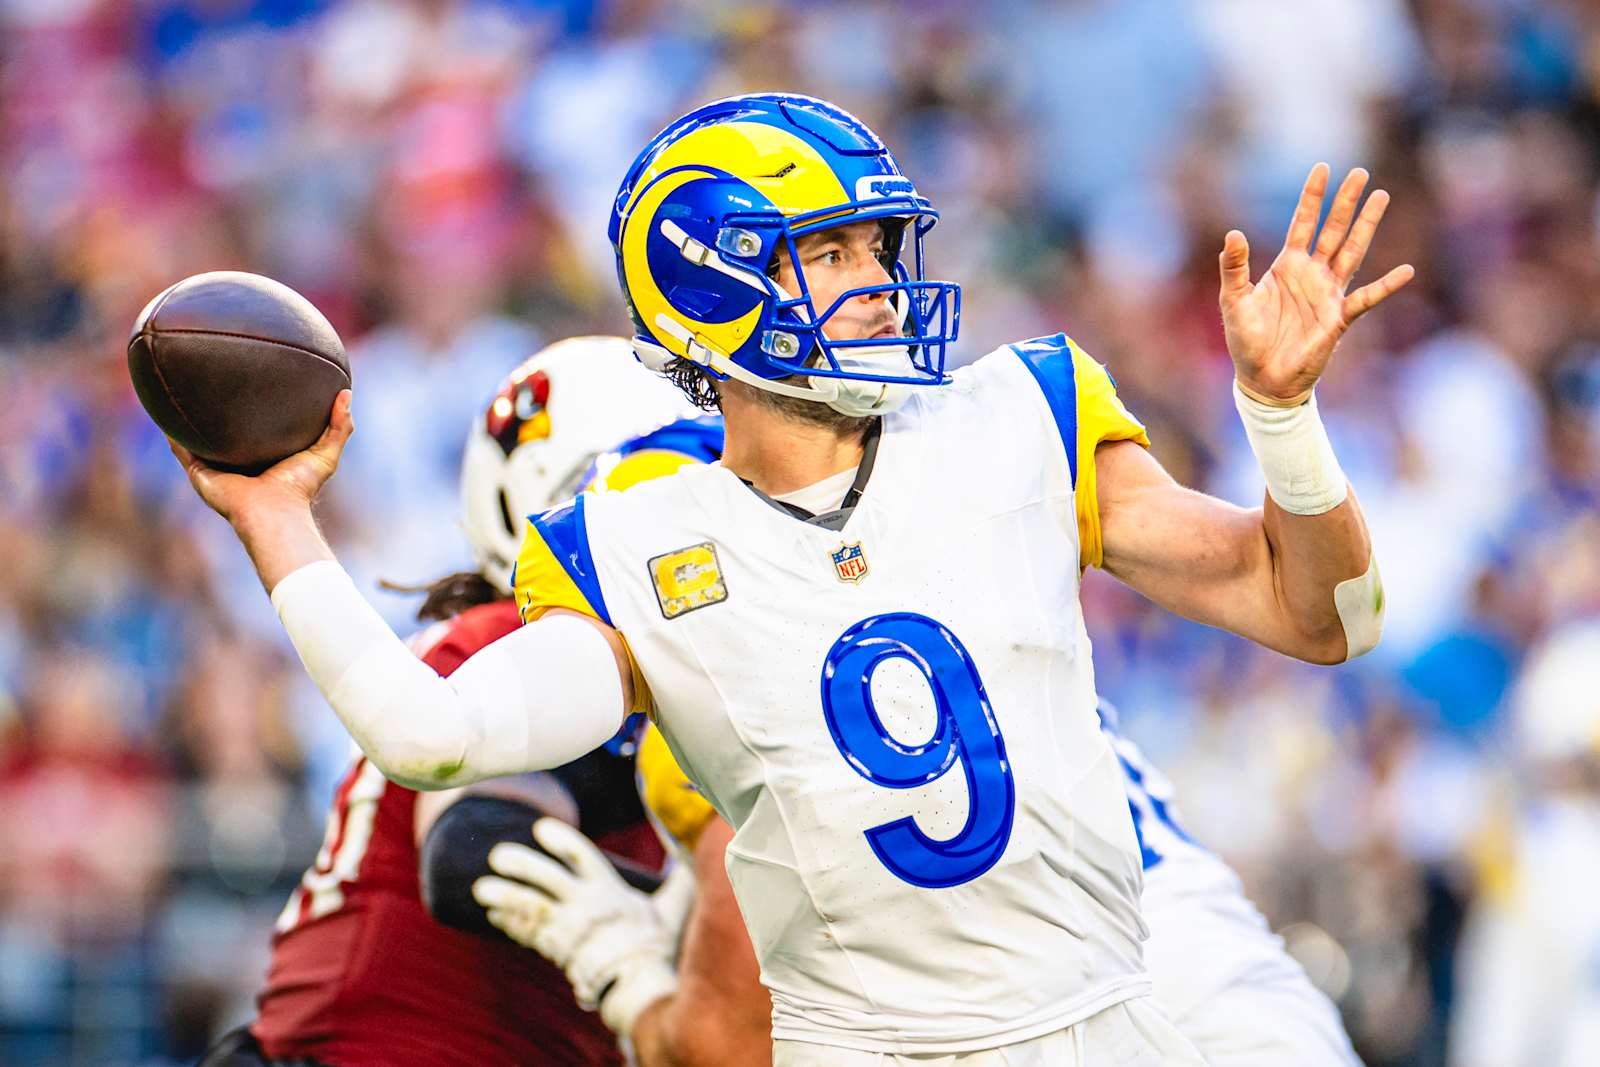
Los Angeles beat Arizona 34–6, producing the largest Efficiency improvement of the week when both cutoffs use the refreshed feed: +3.55 points. The defense drove much of that gain, holding the Cardinals to −0.521 EPA per play. The Rams’ offense added +0.255.
Matthew Stafford threw three touchdowns to three different targets while the offense worked around the absences of Puka Nacua and Davante Adams. Los Angeles heads into its bye with four consecutive wins and a +6.56 DEPI rating, built on +4.49 offense and +2.56 defense.
The base rating does not automatically price every non-QB injury. The receiver situation remains relevant when evaluating their next matchup, and the dashboard’s injury-cluster controls allow that scenario to be explored. Rams recap.
4. Chicago Bears — 63.18
| **7–2 | Previous: 2 | DEPI: 3** |
Chicago had the week off and still moved down two places in the published Efficiency comparison.
That is partly the revised earlier data and partly the progress of the teams around it. On consistent inputs, the Bears’ score moves just −0.27, through changes in opponent and league estimates as the rest of the schedule plays out.
Chicago remains third in DEPI at +5.39, with a +3.70 offensive contribution. The Rams are only 0.06 points ahead in Efficiency. There is little reason to draw a major distinction between those two season profiles based on their rounded scores. New Orleans visits Soldier Field next.
5. Cincinnati Bengals — 61.42
| **7–2 | Previous: 8 | DEPI: 4** |
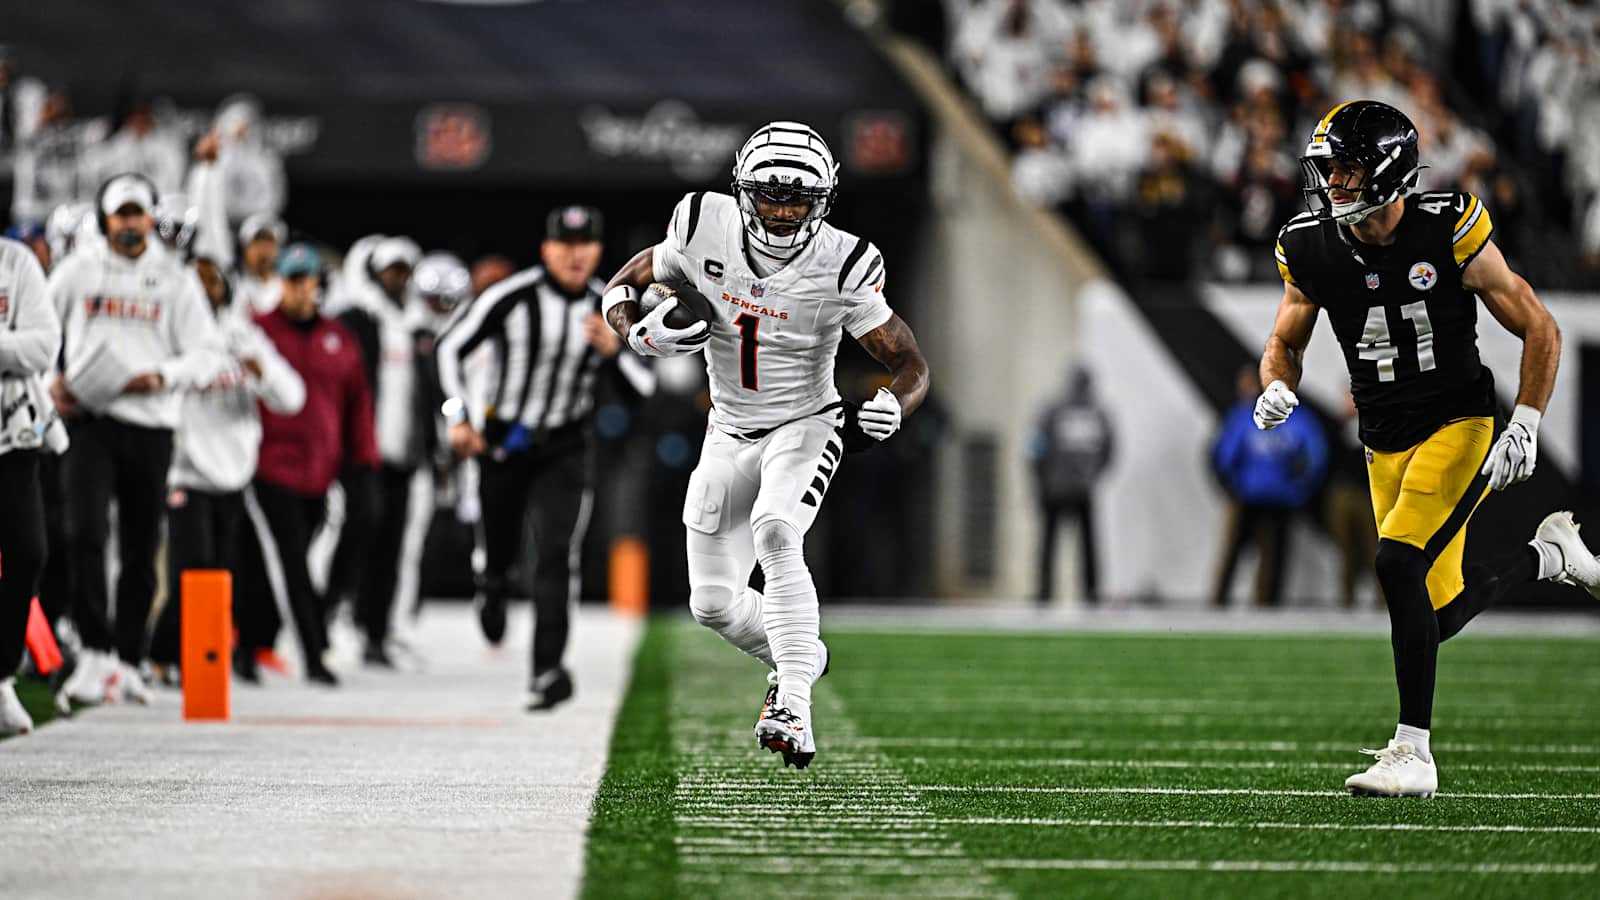
Joe Burrow and Ja’Marr Chase turned Sunday night into a difficult experience for Pittsburgh’s secondary.
Burrow threw for 409 yards and four touchdowns. Chase caught 11 passes for 231 yards, and the Bengals won 38–18 to take sole possession of first place in the AFC North.
Cincinnati averaged +0.368 offensive EPA per play, but the improvement extended to its adjusted defense. Its consistent-input Efficiency score rose 2.92 points, while DEPI gained 1.04, the largest published DEPI increase of the week.
The Bengals now sit fourth at +5.27. Their offense supplies +4.72 points, and the defense’s −0.69 is a smaller drag than it was a week ago. With that offense, even modest defensive improvement goes a long way. Bengals recap.
6. Detroit Lions — 59.78
| **7–2 | Previous: 9 | DEPI: 5** |
Detroit delivered one of the week’s most complete performances, beating New England 35–10 in Munich.
Jahmyr Gibbs produced 252 yards from scrimmage, and Amon-Ra St. Brown scored twice. The Lions averaged +0.236 offensive EPA per play and allowed −0.264. Both adjusted scrimmage units improved, lifting their consistent-input Efficiency score 3.46 points.
The defense is the more consequential development for their projection. Its DEPI contribution has moved above average to +0.11, alongside a +3.80 offense. Detroit is fifth overall at +4.81. The Lions have the offensive foundation of a contender; getting more support from the defense makes that outlook easier to trust. Lions recap.
7. Kansas City Chiefs — 59.24
| **7–2 | Previous: 7 | DEPI: 8** |
Patrick Mahomes threw for 348 yards and five touchdowns as Kansas City beat Atlanta 35–13.
The Chiefs’ adjusted defense supplied most of their 0.59-point Efficiency improvement on consistent inputs. They allowed −0.268 EPA per play, although special teams offset part of the benefit.
DEPI still takes a more conservative view of Kansas City than its record might suggest, ranking the Chiefs eighth at +2.20. The projected defense contributes +0.82, while special teams subtract 0.92. Kansas City has separated itself from much of the league, but the model still sees a substantial gap to the projected top seven. That becomes especially relevant with the Chiefs laying more than two touchdowns against Arizona. Chiefs postgame notes.
8. Seattle Seahawks — 58.23
| **6–4 | Previous: 10 | DEPI: 9** |
Drew Lock threw for 240 yards and two touchdowns in a 21–13 win over Las Vegas. Seattle’s defense held the Raiders to 27 second-half yards, and both adjusted scrimmage units improved.
The resulting 1.68-point Efficiency gain on consistent inputs moves the Seahawks to eighth. They also return to DEPI’s top 10 at +1.91.
There is an important quarterback distinction. Efficiency includes what Lock actually produced. The forward-looking default assumes Sam Darnold, with Seattle optimistic he can return after the bye. That remains dependent on his recovery and practice work. The Seahawks’ next game is against San Francisco, making the quarterback decision significant for the NFC West race. Seahawks recap.
9. Buffalo Bills — 58.12
| **8–1 | Previous: 6 | DEPI: 7** |
Buffalo beat the Jets 31–12, with James Cook rushing for 157 yards, including a 74-yard touchdown.
The Bills produced +0.297 offensive EPA per play and allowed −0.097. Both adjusted scrimmage components improved, with special teams partially offsetting the gains. On consistent inputs, their Efficiency score rose 0.64 points.
The drop from sixth to ninth in the published editions therefore needs context: revised earlier data and larger improvements elsewhere moved Buffalo down despite another good result. DEPI has the Bills seventh at +4.45.
There is also another opposing-quarterback caveat. Geno Smith left with an ankle injury, and Cade Klubnik played much of the second half. Buffalo’s defense did its job, but the opponent’s availability remains part of the evaluation. Bills recap · Jets quarterback update.
10. Tampa Bay Buccaneers — 57.68
| **3–6 | Previous: 4 | DEPI: 11** |
Tampa Bay’s six-place decline is the largest published Efficiency drop, and the Bucs did not play.
Their score changes just −0.04 when both weeks are calculated from the refreshed feed. This is primarily a revision to the existing season and a change in the ordering of teams around them.
The familiar imbalance remains. DEPI gives Tampa Bay +2.18 points on defense and −1.78 on offense, putting the Bucs 11th overall at +1.42. They travel to Detroit for a matchup between two teams in the Efficiency top 10. That should offer a better test of Tampa Bay’s standing than movement during its bye.
The Biggest Risers
The Rams, Lions and Bengals have the clearest performance-driven gains. They produce the three largest consistent-input Efficiency improvements, at +3.55, +3.46 and +2.92, respectively. Cincinnati’s +1.04 published DEPI gain narrowly leads Tennessee’s +1.02 and Cleveland’s +0.99. The Rams gain +0.96.
Cleveland and Indianapolis climb four Efficiency places. The Browns move from 27th to 23rd after overcoming a 17–0 deficit to beat Houston 27–24. The Colts move from 24th to 20th after a 24–22 win over Miami ends their five-game losing streak. Both improve on consistent inputs, by 1.47 and 1.26 points, respectively. Their forward-looking positions remain modest: Cleveland is 25th in DEPI, Indianapolis 19th. Browns recap · Colts recap.
Minnesota moves from 16th to 13th in DEPI. Kirk Cousins returned and threw two touchdown passes in a 30–10 win at Green Bay. The Vikings improve 1.87 Efficiency points on consistent inputs and head to Mexico City at 7–2. Cousins is already the model’s assumed starter for Week 11. Vikings observations.
The Biggest Fallers
Pittsburgh suffers the largest setback. The Steelers lose 4.70 Efficiency points on consistent inputs and fall five DEPI places, from 12th to 17th. Their 1.38-point DEPI decline is also the largest of the week. Burrow’s passing performance exposes a defense that had helped Pittsburgh build a four-game winning streak.
New England’s defeat carries a substantial cost. The Patriots lose 4.60 Efficiency points on consistent inputs and 1.14 DEPI points against the prior published snapshot. They remain tenth in DEPI, but the gap to the strongest teams is growing after Detroit held their offense to −0.264 EPA per play.
Houston falls four DEPI places, from 17th to 21st. The loss at Cleveland leaves the Texans rated slightly below Indianapolis, despite a Week 11 market that makes Houston an overwhelming favorite. That disagreement needs a closer look at the injury report.
Tampa Bay and Buffalo feature among the largest published Efficiency rank declines, but the data revisions make their movements a different story from Pittsburgh’s and New England’s losses.
DEPI: The Rams Are Almost Level With San Francisco
| Rank | Team | Record | DEPI pts | Change | EI rank |
|---|---|---|---|---|---|
| 1 | San Francisco 49ers | 8-1 | +6.76 | — | 2 |
| 2 | Los Angeles Rams | 6-4 | +6.56 | ↑ 1 | 3 |
| 3 | Chicago Bears | 7-2 | +5.39 | ↓ 1 | 4 |
| 4 | Cincinnati Bengals | 7-2 | +5.27 | ↑ 2 | 5 |
| 5 | Detroit Lions | 7-2 | +4.81 | ↑ 2 | 6 |
| 6 | Jacksonville Jaguars | 7-2 | +4.77 | ↓ 2 | 1 |
| 7 | Buffalo Bills | 8-1 | +4.45 | ↓ 2 | 9 |
| 8 | Kansas City Chiefs | 7-2 | +2.20 | ↑ 1 | 7 |
| 9 | Seattle Seahawks | 6-4 | +1.91 | ↑ 2 | 8 |
| 10 |  New England Patriots | 5-5 | +1.48 | ↓ 2 | 13 |
DEPI is expressed in points relative to an average NFL team on a neutral field. Movement compares with the final published Week 9 dashboard, including the quarterback updates made after last week’s article.
The first seven teams now sit between +4.45 and +6.76. Kansas City is eighth at +2.20, more than two points behind Buffalo.
The Rams are the most striking development near the top. Their +4.49 offense and +2.56 defense give them strength on both sides of the ball, while San Francisco’s +5.91 offense does more of the work for the 49ers. Los Angeles is just 0.21 points behind overall.
Chicago, Cincinnati and Detroit complete the top five. Jacksonville and Buffalo both win comfortably but fall two places as revised inputs, opponent estimates and other teams’ improvements reshape the order.
Seattle replaces Tampa Bay in the top 10. The difference between those two teams is modest, but the expected return of Darnold is relevant to Seattle’s outlook.
The Ravens Rise in DEPI After Another Loss
Baltimore’s fifth consecutive defeat was particularly painful. The Chargers arrived without a win and left with a 23–20 victory after Zay Flowers lost a fumble on the Ravens’ final possession. Baltimore is now 4–6. Ravens recap.
The Ravens remain 17th in Efficiency at 45.20, losing 1.45 points on consistent inputs. Defense accounts for the largest negative contribution to that adjusted weekly change.
DEPI, however, moves Baltimore from 22nd to 18th, with its rating improving 0.46 points to −0.99.
The projected offense contributes most of the gain. Relative to the final Week 9 snapshot, the changes are approximately +0.38 offense, −0.12 defense, +0.07 special teams and +0.13 quarterback. Brissett was already the expected starter in that snapshot, so this is improvement with the same quarterback assumption. Declines by nearby teams, including Pittsburgh and Houston, help explain the larger rank movement.
That gives Baltimore a slightly better outlook than it had a week ago. It still leaves the Ravens below average.
The current model makes Carolina a 0.93-point favorite in Week 11, compared with a market line of Panthers −2.5. Switching the dashboard to Lamar Jackson adds approximately 3.16 points relative to Brissett and would make Baltimore about 2.23-point favorites, holding the other assumptions fixed. That is the sensitivity of the projection to the quarterback choice; the published base case uses Brissett.
The Biggest Week 11 Gaps Between DEPI and the Market
| Matchup | DEPI spread | Market spread | Gap |
|---|---|---|---|
| IND at HOU | HOU −1.48 | HOU −12.50 | 11.02 |
| ARI at KC | KC −8.25 | KC −15.50 | 7.25 |
| NYJ at LAC | NYJ −1.20 | LAC −3.00 | 4.20 |
| LV at DEN | DEN −6.32 | DEN −10.00 | 3.68 |
| MIA at BUF | BUF −13.01 | BUF −16.50 | 3.49 |
| MIN vs. SF | SF −6.16 | SF −3.00 | 3.16 |
| CIN at WAS | CIN −3.90 | CIN −6.50 | 2.60 |
Market lines are the dashboard’s November 18, 2:39 p.m. EST snapshot. The gap is the difference between projected and market margins, in points. The table uses the default quarterback choices and zero manually entered injury-cluster adjustments.
Indianapolis at Houston: The Largest Gap Has an Injury Problem
The model rates Indianapolis −1.12 and Houston −1.17 on neutral ground. Home field supplies almost all of its Houston −1.48 projection. The captured market is Houston −12.5, an 11.02-point discrepancy toward Indianapolis.
That is an enormous disagreement, but Indianapolis has ruled out both starting tackles, Bernhard Raimann and Jalen Travis, along with cornerback Charvarius Ward. Cornerback Sauce Gardner and backup tackle Charlie Heck are questionable. The combination creates potential problems in protection and coverage. Colts final injury report.
The published base projection has no manually entered cluster penalty. Those absences could help explain part of the market disagreement, although the injury report alone does not tell us how many points they are worth. This is a good example of a matchup that needs the dashboard’s injury tools before interpreting the raw gap as a betting recommendation.
Arizona at Kansas City: How Much Should the Chiefs Lay?
DEPI makes Kansas City an 8.25-point favorite, compared with the captured market’s 15.5. The 7.25-point difference favors Arizona at that price.
The Chiefs are eighth in DEPI, while Arizona is 28th at −4.51. The model already assumes Carson Beck starts for the Cardinals, with a −2.12 quarterback contribution. Kansas City’s −0.92 special-teams contribution also limits the projected margin.
This disagreement survives the rookie-quarterback adjustment. The model sees a clear Chiefs advantage but a smaller separation than the market.
Jets at Chargers: Different Favorites
DEPI projects Jets −1.20, while the market makes the Chargers 3-point favorites. That produces a 4.20-point discrepancy toward New York.
The default assumes Geno Smith. He practiced on a limited basis Wednesday after leaving the Buffalo game with an ankle injury, and New York had yet to commit to its starter. Choosing Cade Klubnik reduces the Jets’ projection by 1.08 points, bringing the model close to a pick’em and shrinking the gap to about 3.12 points at Chargers −3.
Two More Large Favorites
The model makes Denver −6.32 against a market of −10, and Buffalo −13.01 against −16.5. Those gaps point toward Las Vegas and Miami at the captured prices.
Fernando Mendoza and Kyle McCord are already the assumed starters for the Raiders and Dolphins. The quarterback changes therefore do not explain away those disagreements. They reflect a difference in how much separation to assign between the teams, even with the weaker quarterbacks accounted for.
Week 11 Matchup to Watch: Vikings vs. 49ers in Mexico City
| **Sunday, November 22 | 8:20 p.m. EST | Mexico City** |
Minnesota and San Francisco have the best combined rankings on this week’s schedule in both indexes. The 49ers are second in Efficiency and first in DEPI; the Vikings are 12th and 13th.
DEPI projection: San Francisco −6.16
Captured market: San Francisco −3
The venue is treated as neutral, with zero home-field adjustment. The resulting 3.16-point gap favors San Francisco at the captured line.
The central matchup is San Francisco’s +5.91-point offense against Minnesota’s +1.87 defense. The Vikings’ projected offense remains −3.01, even with Cousins’ positive quarterback contribution. That explains why DEPI is more cautious about Minnesota than its 7–2 record might suggest.
Still, the 49ers just allowed 40 points, and their projected defensive contribution is only +0.42. Cousins has an opportunity to make this more competitive if Minnesota can protect him and sustain drives. San Francisco is preparing for the altitude in Colorado Springs, an additional piece of matchup context beyond the model’s neutral-venue treatment. 49ers recap and travel plans.
Tampa Bay at Detroit is the other matchup to watch near the top of the Efficiency table. DEPI makes Detroit 4.93-point favorites, compared with a captured line of 7, leaving a 2.07-point gap toward Tampa Bay.
How the Model Did Against the Spread
Week 10 finishes 5–9 against the first recorded line, 6–8 against the best recorded line and 6–8 against closing. All 14 games have saved pregame forecasts.
The full-season closing record is 72–72–6. That includes 40–45–1 for forecasts saved before kickoff and 32–27–5 for retrospective replays. Across the 72 games with captured early-price history, first recorded and best recorded are both 36–35–1. These groups cover different sets of games and include earlier versions of the model.
The best recorded line is a hindsight benchmark using the largest captured discrepancy for the saved projection. It does not establish that the line was available at the moment a reader would have placed a bet. The results page now displays the full-season records alongside the weekly breakdown and lets you choose which line comparison to view.
Explore the complete NFL rankings, review the model methodology, compare Week 11 projected spreads and track results against the market.
Rankings include all 14 Week 10 finals and 150 season games. Ratings and market lines reflect the November 18, 2026, 2:39 p.m. EST snapshot. Updated public play-by-play revises earlier EPA values; rank movements compare published editions, while discussion of weekly Efficiency score effects uses both cutoffs recalculated from the refreshed data. Ratings, expected starters and market lines may change after this snapshot.