Jacksonville has taken the top spot. San Francisco has the best offense. Seattle still has one of the best defenses. And Minnesota has reached the top 10 with the worst adjusted offense in the league.
There is plenty to explain after four weeks, starting with a change to the index itself.
This week’s Dual Eights Efficiency Index introduces v2.1. The original formula averaged league percentiles for offensive and defensive EPA and success rate. The updated formula adjusts scrimmage performance for opponent strength and venue, estimates dropbacks and designed runs separately, and reduces the weight of fourth-quarter plays when the game is largely decided. It also preserves the size of performance differences, rather than reducing every component to its place in the league.
Offense and defense now account for 45% each, with context-adjusted special teams making up the remaining 10%. Field goals, extra points, punts and kickoffs finally have a place in the overall score.
The displayed score also uses a new scale, so this week’s points are not directly comparable with last week’s. We have kept the published Week 3 rankings as our reference. Movement this week reflects both Week 4 results and the formula change. Where the revised method appears to be influencing a team’s position, that belongs in the explanation.
The index still measures observed efficiency. Injuries, projected lineups and preseason expectations are outside the formula. Four games also remain four games, however carefully we arrange the numbers.
Week 4 Dual Eights Efficiency Index Top 10
| Rank | Team | Record | Index | Week 3 rank | Places gained* |
|---|---|---|---|---|---|
| 1 |  Jacksonville Jaguars Jacksonville Jaguars | 3-1 | 68.1 | 2 | +1 |
| 2 |  San Francisco 49ers San Francisco 49ers | 4-0 | 67.3 | 6 | +4 |
| 3 |  Seattle Seahawks Seattle Seahawks | 3-1 | 65.2 | 3 | 0 |
| 4 |  Kansas City Chiefs Kansas City Chiefs | 4-0 | 64.1 | 1 | -3 |
| 5 |  Chicago Bears Chicago Bears | 3-1 | 63.0 | T-7 | +2 |
| 6 |  Baltimore Ravens Baltimore Ravens | 3-1 | 60.5 | 5 | -1 |
| 7 |  Minnesota Vikings Minnesota Vikings | 4-0 | 58.5 | T-13 | +6 |
| 8 |  Carolina Panthers Carolina Panthers | 2-2 | 58.0 | 10 | +2 |
| 9 |  Atlanta Falcons Atlanta Falcons | 2-2 | 57.1 | 9 | 0 |
| 10 |  Los Angeles Rams Los Angeles Rams | 2-2 | 56.1 | T-7 | -3 |
Places gained compares Week 4 v2.1 with the existing Week 3 rankings under the original formula. Positive means a rise. It combines new game information with the methodology change; it is not a measure of Week 4 performance alone.
1. Jacksonville Jaguars — 68.1
3–1 · Published Week 3 rank: 2 · Adjusted offense: 2 · Defense: 5 · Special teams: 18
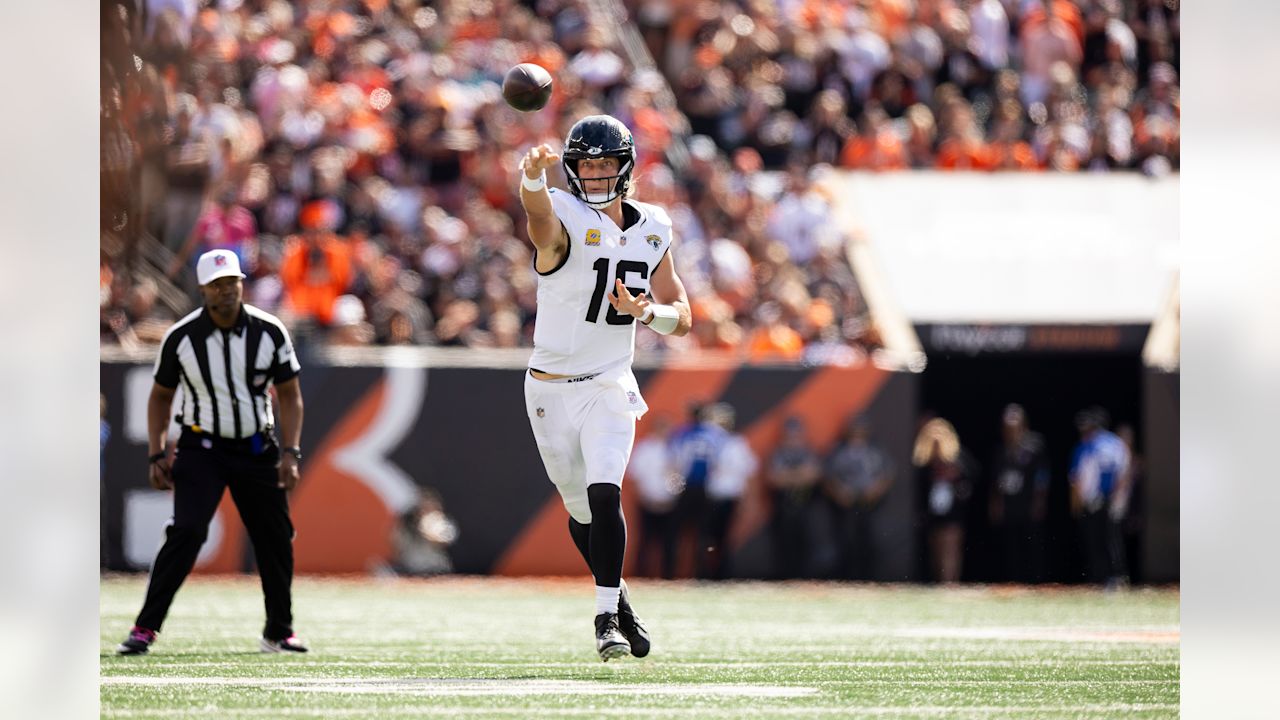
Jacksonville has the strongest overall combination of offense and defense. Its adjusted offense is second in both EPA and success, while its defense ranks fifth when those two components are combined. Special teams are closer to the middle, but there is enough strength on both sides of scrimmage to lead the table.
The Jaguars generated +0.213 raw offensive EPA per eligible play in their 22–17 win at Cincinnati. Their defense allowed positive EPA and a 46.5% success rate, so this was not a defensive demolition. Two interceptions and a late Chris Rodriguez Jr. touchdown helped secure the result. (Jaguars game report)
Jacksonville moves up one spot from the published Week 3 list. Its score falls from 82.8 to 68.1 because the scoring scale changed. That is the first useful reminder to compare the football, not subtract points across two different formulas.
2. San Francisco 49ers — 67.3
4–0 · Week 3: 6 · Offense: 1 · Defense: 22 · Special teams: 10
San Francisco’s offense is not merely first. Its adjusted standardized strength is +1.768, well ahead of Jacksonville’s second-place +1.063. The raw numbers tell the same broad story: a league-best +0.291 offensive EPA per play and 54.5% success rate.
Preserving the magnitude of that advantage matters. The old percentile formula could record that San Francisco was first without fully expressing how far ahead it was. At the same Week 4 cutoff, the original calculation placed the 49ers ninth; v2.1 puts them second.
The 24–14 win over Denver was another victory, but San Francisco’s raw offensive EPA for that game was below its exceptional cumulative level. The formula change deserves a prominent role in explaining the climb. A 22nd-ranked adjusted defense keeps the profile from being complete.
3. Seattle Seahawks — 65.2
3–1 · Week 3: 3 · Offense: 15 · Defense: 2 · Special teams: 7
Seattle has the defensive answer to San Francisco’s offense, and we will get to see those units against each other Sunday.
The Seahawks remain second in both raw defensive EPA allowed and opponent success rate. Their adjusted defense is also second, with seventh-ranked special teams providing additional support. The offense is a more ordinary 15th.
Seattle beat the Chargers 30–23 despite producing −0.088 raw offensive EPA per eligible play. The defense supplied the finish, with Uchenna Nwosu forcing a Justin Herbert fumble and Derick Hall recovering. (Seahawks recap)
The ranking remains third through the formula transition. That stability is useful, even if it does not mean each part of the calculation was unchanged.
4. Kansas City Chiefs — 64.1
4–0 · Week 3: 1 · Offense: 4 · Defense: 9 · Special teams: 11
Kansas City remains one of the league’s most balanced teams. A fourth-ranked offense, ninth-ranked defense and 11th-ranked special-teams unit leave few obvious weak spots.
The Chiefs held off Las Vegas 30–27, with Xavier Nwankpa’s late interception helping close the game. The Raiders generated +0.034 raw offensive EPA per play and a 48.0% success rate, giving Kansas City a more competitive afternoon than the unbeaten record might suggest. (Chiefs recap)
Still, the three-place fall should not be assigned entirely to that game. The already calculated original formula had Kansas City first through Week 4; the revised formula has it fourth. The Chiefs enter their bye with an excellent profile and a different spot in the table.
5. Chicago Bears — 63.0
3–1 · Week 3: T-7 · Offense: 8 · Defense: 13 · Special teams: 5
Chicago keeps producing through changing quarterbacks. Tyson Bagent threw for 268 yards in the 23–12 win over the Jets, while Kyle Monangai ran for 146 yards and two touchdowns. Bagent became the third Bears quarterback to lead a win in the opening four games. (Bears recap)
The underlying Week 4 numbers were strong: Chicago succeeded on 54.7% of its eligible offensive plays and held the Jets to −0.137 EPA per play.
The adjusted defense ranks a more modest 13th, but an eighth-ranked offense and fifth-ranked special-teams unit put the Bears fifth overall. That is a two-place rise against the published Week 3 ranking.
6. Baltimore Ravens — 60.5
3–1 · Week 3: 5 · Offense: 6 · Defense: 12 · Special teams: 15
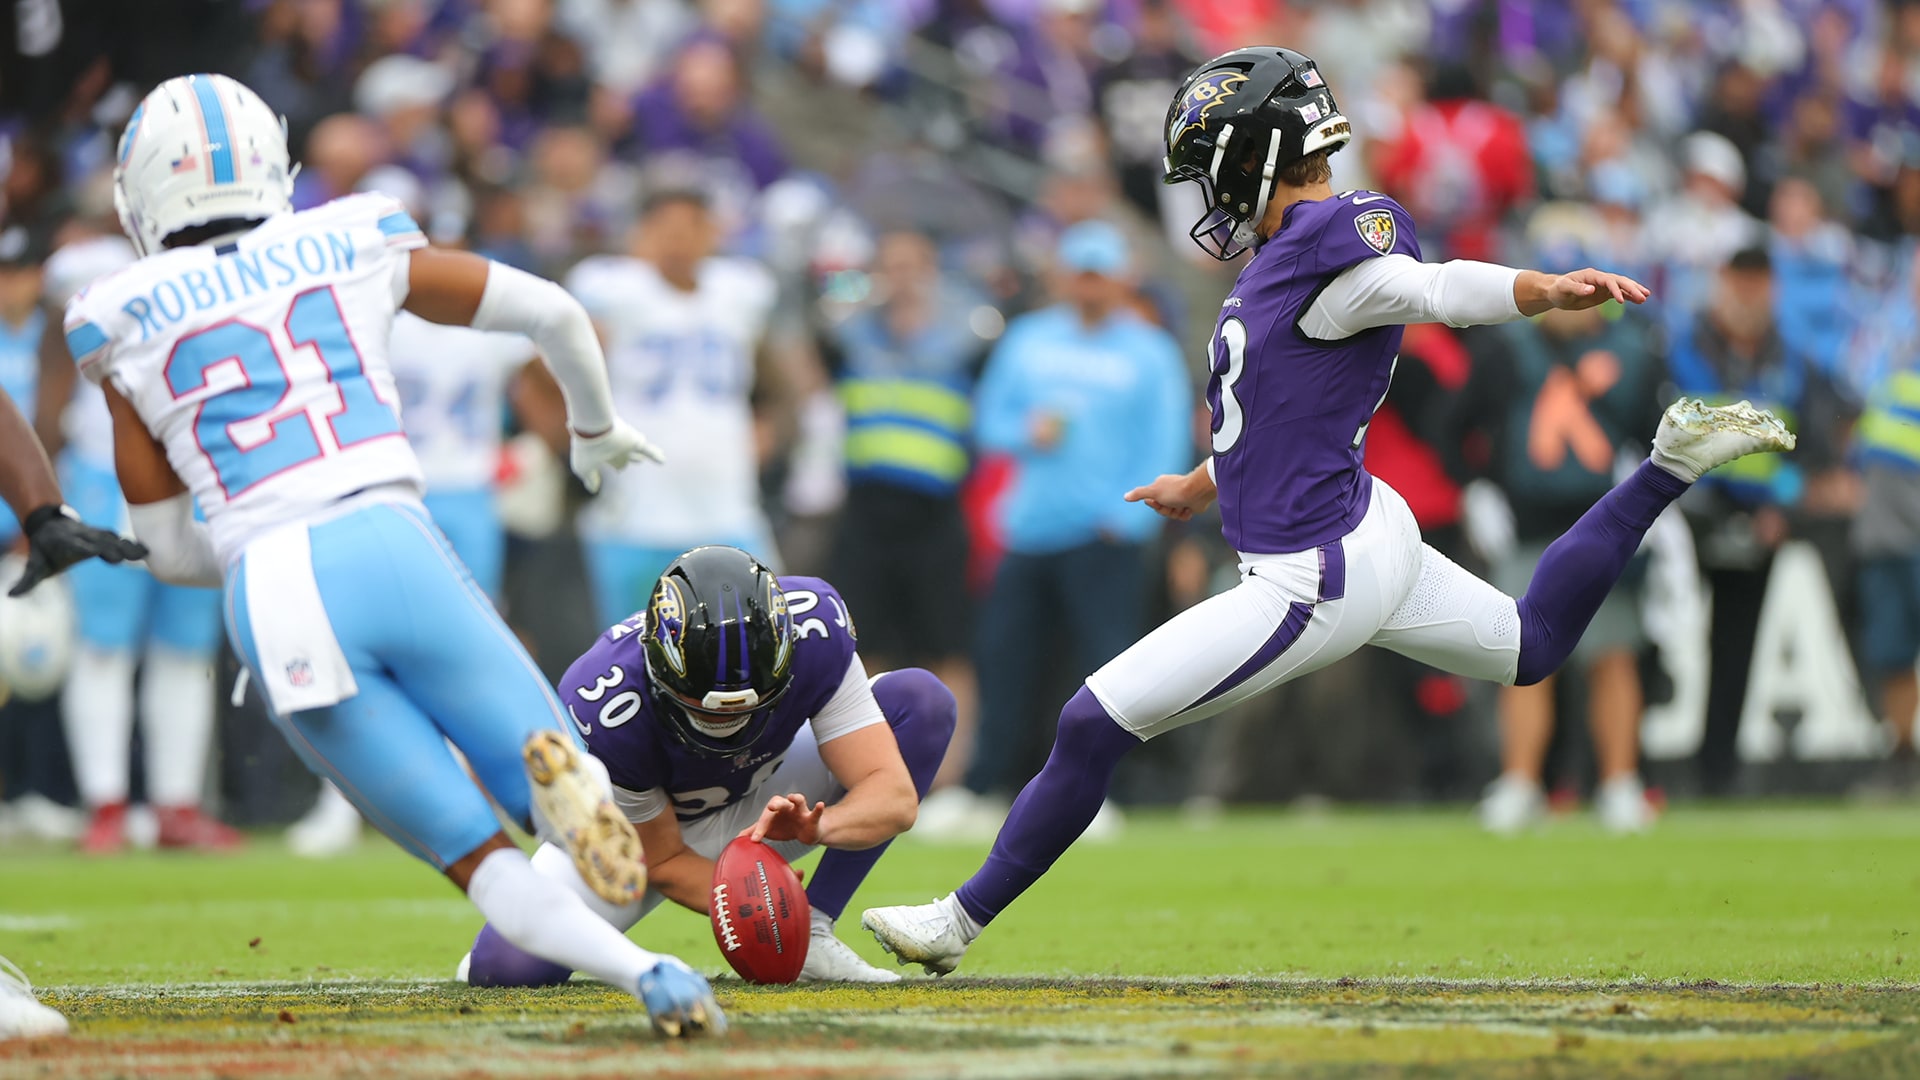
The Ravens’ defensive performance against Tennessee supplied something real to build on. The Titans generated −0.157 raw offensive EPA per eligible play and succeeded on just 36.2% of those snaps.
Baltimore’s offense, however, played two very different halves. It generated +0.430 raw EPA per eligible play before halftime and −0.169 afterward. Lamar Jackson left with an ankle injury, the Ravens became more conservative with Tyler Huntley, and a 24–7 lead became a 24–18 finish. Those circumstances are important context, even if the split cannot tell us what either quarterback would produce over a full game. (Ravens injury report)
Baltimore is sixth under v2.1, compared with fifth in the published Week 3 table. The original Week 4 calculation had the Ravens second, so the new method is part of the story here too.
The bigger question for Atlanta is who plays quarterback. NFL Network reported Tuesday that Jackson has an outside chance to play Sunday. The index describes Baltimore’s completed games; it does not adjust the rating for his potential absence.
7. Minnesota Vikings — 58.5
4–0 · Week 3: T-13 · Offense: 32 · Defense: 1 · Special teams: 2
Minnesota is the most revealing team in the new top 10. The Vikings have the worst adjusted offense, the best adjusted defense and the second-best special teams.
Their 15–10 win over Miami fits that identity. Minnesota allowed −0.204 raw offensive EPA per eligible play, adding another strong defensive game to a sample that already leads the league in both defensive EPA and opponent success rate.
Special teams have generated +4.93 context-adjusted points per game before the small-sample shrinkage used in the index. That new component helps carry a team with a 33.2% raw offensive success rate into seventh. The ranking is encouraging; the offensive problem remains obvious.
8. Carolina Panthers — 58.0
2–2 · Week 3: 10 · Offense: 9 · Defense: 11 · Special teams: 14
Carolina’s 32–26 win over Detroit included +0.289 raw offensive EPA per eligible play, one of the week’s strongest offensive performances.
The cumulative profile is reasonably balanced. The offense ranks ninth after adjustment, the defense 11th and special teams 14th. Raw offensive EPA is eighth, while offensive success is 15th, illustrating why average play value and the frequency of successful plays remain useful separate measures.
The Panthers climb two places from the published Week 3 list. The original Week 4 formula had them 11th, while v2.1 keeps them inside the top 10 heading into their bye.
9. Atlanta Falcons — 57.1
2–2 · Week 3: 9 · Offense: 13 · Defense: 3 · Special teams: 28
Atlanta produced the best raw Week 4 offensive EPA in the league: +0.421 per eligible play, with a 59.3% success rate in its 45–24 Monday win over New Orleans. The Falcons also allowed −0.073 EPA per play and a 36.2% opponent success rate.
That is a strong week, and the adjusted defense now ranks third. Yet Atlanta remains ninth against the published Week 3 ranking because the formula is changing at the same time the new game arrives.
Special teams are a significant drag: 28th, at −4.14 context-adjusted points per game before shrinkage. The original Week 4 calculation had Atlanta tied sixth. The revised version highlights an issue Baltimore may have an opportunity to exploit Sunday night.
10. Los Angeles Rams — 56.1
2–2 · Week 3: T-7 · Offense: 10 · Defense: 4 · Special teams: 30
The Rams’ defense had an excellent afternoon in Philadelphia. The Eagles generated −0.287 raw offensive EPA per eligible play and succeeded on 32.8% of their snaps. They also went 0-for-12 on third down and 1-for-4 on fourth down. (Rams defensive recap)
The 24–20 win helps support a fourth-ranked adjusted defense. It does not erase 30th-ranked special teams, whose cumulative context-adjusted value is −5.72 points per game before shrinkage.
The original Week 4 formula ranked the Rams third; v2.1 places them 10th. They fall three spots against the published Week 3 table despite a strong new defensive game. Buffalo’s visit Monday will test the defense again.
Biggest Risers: Indianapolis and the Giants
| Rank | Team | Record | Index | Week 3 rank | Places gained* |
|---|---|---|---|---|---|
| 14 |  Indianapolis Colts Indianapolis Colts | 2-2 | 52.2 | 30 | +16 |
| 13 |  New York Giants New York Giants | 3-1 | 52.4 | 26 | +13 |
| 7 | Minnesota Vikings | 4-0 | 58.5 | T-13 | +6 |
| 12 |  Denver Broncos Denver Broncos | 2-2 | 53.1 | T-18 | +6 |
| 24 |  Philadelphia Eagles Philadelphia Eagles | 2-2 | 41.2 | 29 | +5 |
Indianapolis rises 16 places, from 30th to 14th, after beating Washington 30–13 in London. The Colts allowed −0.250 raw EPA per eligible play and a 27.9% success rate, so there is clear new defensive evidence behind the result. But their cumulative adjusted defense is 21st and offense 17th. Third-ranked special teams give the new formula another reason to value them.
The Giants climb 13 places to 13th after beating Arizona 36–24. Their offense is 24th and defense 15th, while special teams lead the league at +6.13 context-adjusted points per game before shrinkage. That is a particularly important methodology note for anyone wondering how a middling scrimmage profile reached the upper half.
Minnesota and Denver each rise six places. Minnesota’s defense and special teams do the carrying; Denver’s seventh-ranked adjusted defense helps explain its standing despite a loss in San Francisco. Philadelphia rises five places despite its poor offensive game against the Rams, with eighth-ranked special teams supporting an otherwise weak profile.
For a clearer view of the formula effect, hold the cutoff fixed. Using the original Week 4 calculation already produced, Indianapolis was tied 23rd, the Giants tied 26th and Denver 22nd. With exactly the same Week 4 cutoff under v2.1, they are 14th, 13th and 12th. Those differences do not come from adding another game.
They also do not isolate the effect of any one feature. Opponent adjustment, play-type estimates, game-state weights, magnitude-preserving aggregation and special teams change together.
Biggest Fallers: Tennessee, the Jets and Las Vegas
| Rank | Team | Record | Index | Week 3 rank | Places gained* |
|---|---|---|---|---|---|
| 31 |  Tennessee Titans Tennessee Titans | 0-4 | 29.9 | T-18 | -13 |
| 23 |  New York Jets New York Jets | 1-3 | 42.4 | 12 | -11 |
| 20 |  Las Vegas Raiders Las Vegas Raiders | 3-1 | 47.2 | 11 | -9 |
| 11 |  Cincinnati Bengals Cincinnati Bengals | 2-2 | 56.0 | 4 | -7 |
| 21 |  Houston Texans Houston Texans | 0-4 | 46.5 | T-15 | -6 |
Tennessee falls 13 places to 31st. The offense ranks 28th, defense 27th and special teams last. The poor offensive numbers in Baltimore are part of the explanation; a newly counted special-teams weakness adds another.
The Jets fall 11 places to 23rd after their offense produced −0.137 raw EPA per eligible play in Chicago. Their cumulative adjusted defense ranks 25th, with neither offense nor special teams strong enough to compensate.
Las Vegas falls nine places to 20th, but its close loss to Kansas City should not be described as an offensive collapse. The Raiders’ Week 4 raw offensive EPA and success rate were both above their entering cumulative marks. The larger change is how the formula reads their overall profile: fourth in raw defensive EPA allowed becomes 20th in combined adjusted defensive strength. At the same Week 4 cutoff, the original formula had Las Vegas 10th.
Cincinnati falls seven places, from fourth to 11th, and leaves the top 10. Joe Burrow’s 428 passing yards came with two interceptions against Jacksonville; large yardage totals do not guarantee exceptional EPA. Houston falls six places despite producing the best raw offensive EPA among Week 4 losers, while Detroit falls four with a fifth-ranked adjusted offense and a 29th-ranked defense.
This is a week to be precise about what “rising” and “falling” mean. We are comparing published positions across a formula transition. We are not treating every change as a verdict on one Sunday’s performance.
Week 5 Game of the Week: 49ers at Seahawks
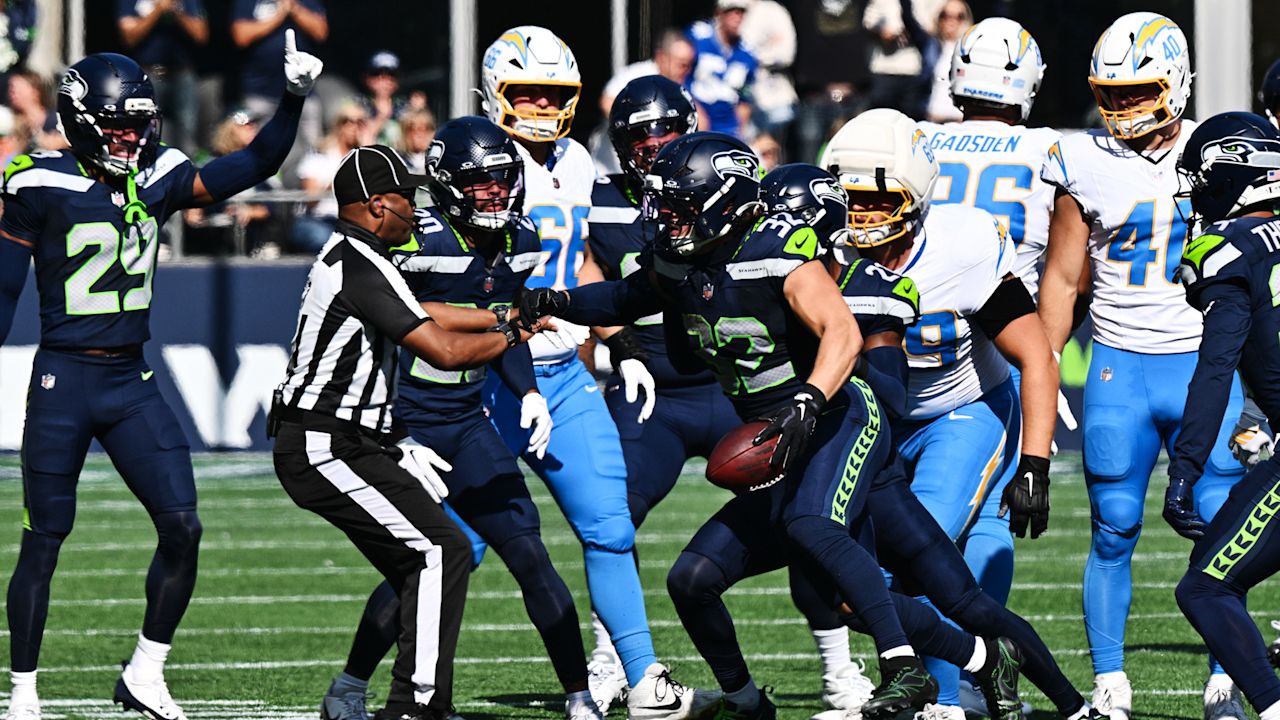
No. 2 San Francisco at No. 3 Seattle — Sunday, October 11, 4:25 p.m. ET, FOX, Lumen Field.
The strongest Week 5 matchup is also one of the closest in the index. San Francisco and Seattle have a combined score of 132.5, highest on the schedule, and a gap of 2.1, second-smallest behind Las Vegas–New England. The 49ers and Seahawks confirm the Sunday afternoon kickoff.
The headline is straightforward: the league’s first-ranked adjusted offense against its second-ranked adjusted defense. San Francisco also leads the raw offensive EPA and success measures, while Seattle is second in both corresponding defensive measures. The matchup holds up before and after adjustment.
The other side deserves equal attention. Seattle’s offense ranks 15th, while San Francisco’s defense ranks 22nd. If the marquee units trade blows, the less imposing ones may determine the result. Seattle also has a modest special-teams edge, seventh versus 10th.
The 2.1-point gap is an index difference, not a betting spread or a predicted scoring margin. Adding the scores is an editorial way to find a high-quality pairing, not a calibrated forecast of how entertaining the game will be.
Baltimore at Atlanta is the second choice, with a combined 117.6 and a 3.3-point gap. Baltimore’s sixth-ranked adjusted offense against Atlanta’s third-ranked defense is compelling, but Jackson’s availability could substantially change the actual matchup without changing what these teams have done through four weeks.
Buffalo at the Rams on Monday night offers another strong unit matchup: the Bills’ third-ranked adjusted offense against Los Angeles’ fourth-ranked defense. Buffalo’s 31st-ranked defense and the Rams’ 30th-ranked special teams give both sides something less reassuring to manage.
All 32 Teams
The unit column lists adjusted offense, defense and special-teams ranks. All rankings and scores below use Week 4 v2.1; the Week 3 reference retains the original formula.
| Rank | Team | Record | Index | Week 3 rank | Places gained* | O / D / ST |
|---|---|---|---|---|---|---|
| 1 | Jacksonville Jaguars | 3-1 | 68.1 | 2 | +1 | 2 / 5 / 18 |
| 2 | San Francisco 49ers | 4-0 | 67.3 | 6 | +4 | 1 / 22 / 10 |
| 3 | Seattle Seahawks | 3-1 | 65.2 | 3 | 0 | 15 / 2 / 7 |
| 4 | Kansas City Chiefs | 4-0 | 64.1 | 1 | -3 | 4 / 9 / 11 |
| 5 | Chicago Bears | 3-1 | 63.0 | T-7 | +2 | 8 / 13 / 5 |
| 6 | Baltimore Ravens | 3-1 | 60.5 | 5 | -1 | 6 / 12 / 15 |
| 7 | Minnesota Vikings | 4-0 | 58.5 | T-13 | +6 | 32 / 1 / 2 |
| 8 | Carolina Panthers | 2-2 | 58.0 | 10 | +2 | 9 / 11 / 14 |
| 9 | Atlanta Falcons | 2-2 | 57.1 | 9 | 0 | 13 / 3 / 28 |
| 10 | Los Angeles Rams | 2-2 | 56.1 | T-7 | -3 | 10 / 4 / 30 |
| 11 | Cincinnati Bengals | 2-2 | 56.0 | 4 | -7 | 11 / 14 / 13 |
| 12 | Denver Broncos | 2-2 | 53.1 | T-18 | +6 | 18 / 7 / 17 |
| 13 | New York Giants | 3-1 | 52.4 | 26 | +13 | 24 / 15 / 1 |
| 14 | Indianapolis Colts | 2-2 | 52.2 | 30 | +16 | 17 / 21 / 3 |
| 15 |  Buffalo Bills Buffalo Bills | 3-1 | 51.9 | T-13 | -2 | 3 / 31 / 6 |
| 16 |  Arizona Cardinals Arizona Cardinals | 1-3 | 51.1 | T-18 | +2 | 12 / 16 / 24 |
| 17 |  Tampa Bay Buccaneers Tampa Bay Buccaneers | 0-4 | 50.8 | 17 | 0 | 30 / 6 / 4 |
| 18 |  New England Patriots New England Patriots | 2-2 | 49.0 | T-21 | +3 | 14 / 10 / 27 |
| 19 |  Detroit Lions Detroit Lions | 2-2 | 48.7 | T-15 | -4 | 5 / 29 / 12 |
| 20 | Las Vegas Raiders | 3-1 | 47.2 | 11 | -9 | 16 / 20 / 20 |
| 21 | Houston Texans | 0-4 | 46.5 | T-15 | -6 | 25 / 8 / 21 |
| 22 |  Cleveland Browns Cleveland Browns | 3-1 | 46.1 | T-21 | -1 | 21 / 19 / 19 |
| 23 | New York Jets | 1-3 | 42.4 | 12 | -11 | 20 / 25 / 23 |
| 24 | Philadelphia Eagles | 2-2 | 41.2 | 29 | +5 | 29 / 24 / 8 |
| 25 |  Dallas Cowboys Dallas Cowboys | 2-2 | 40.8 | 23 | -2 | 7 / 32 / 16 |
| 26 |  Pittsburgh Steelers Pittsburgh Steelers | 2-2 | 40.0 | 27 | +1 | 22 / 23 / 25 |
| 27 |  New Orleans Saints New Orleans Saints | 1-3 | 39.6 | 24 | -3 | 19 / 30 / 9 |
| 28 |  Washington Commanders Washington Commanders | 1-3 | 39.5 | 25 | -3 | 27 / 18 / 26 |
| 29 |  Green Bay Packers Green Bay Packers | 2-2 | 38.5 | 31 | +2 | 23 / 26 / 22 |
| 30 |  Los Angeles Chargers Los Angeles Chargers | 0-4 | 35.7 | 28 | -2 | 31 / 17 / 31 |
| 31 | Tennessee Titans | 0-4 | 29.9 | T-18 | -13 | 28 / 27 / 32 |
| 32 |  Miami Dolphins Miami Dolphins | 0-4 | 28.2 | 32 | 0 | 26 / 28 / 29 |
How the Updated Score Works
The scrimmage model estimates offensive and defensive effects simultaneously for EPA and success, separately on dropbacks and designed runs, with a home/away/neutral venue term. A ridge penalty limits extreme estimates in small samples. Fourth-quarter plays keep full weight in competitive game states, tapering to a 25% floor when pre-snap win probability reaches 5% or 95%. Earlier quarters and overtime retain full weight.
The components are standardized using the prior completed regular season, then combined with a common dropback/designed-run mix. Previous team ratings are not imported. Each of the four adjusted scrimmage components carries 22.5%; standardized special-teams value carries 10%.
Special teams compare the resulting expected-point value of live kicks with a prior-season expectation for the kick type, distance or field position, and clock context. Cumulative value is divided by games plus two before standardization to limit the influence of a small sample. This is kick-context adjustment, not an estimate of opposing special-teams strength or weather effects.
The composite is displayed as 50 + 50 × tanh(composite / 2). Fifty is the calibrated average unit-strength reference, not a percentile or a win probability. Rankings use unrounded values; displayed scores use one decimal.
The revised method makes context and performance magnitude explicit. It is not a claim of proven forecasting superiority: the limited historical diagnostics did not establish an improvement in predicting subsequent results. The full methodology records the parameters and limitations.
Data: Dual Eights calculations from nflverse 2026 play-by-play, 2025 calibration data and the league schedule, retrieved October 6. Covers all 64 completed regular-season games through Week 4, including Atlanta–New Orleans on Monday. Only the Week 4 cutoff was calculated under v2.1 for this article; the published Week 3 values were retained.