Statistics through July 19, 2026.
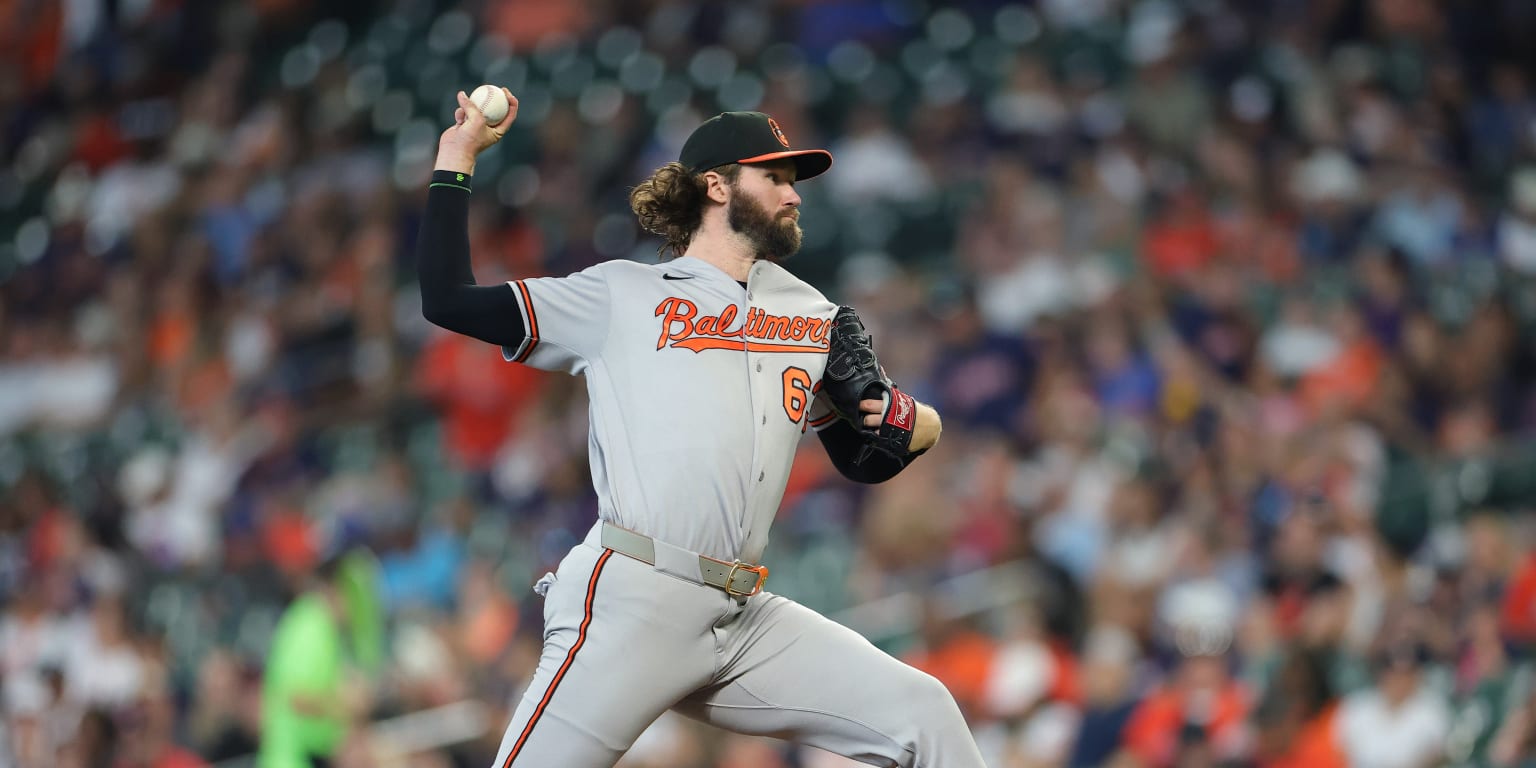
In the Orioles’ season preview, I grouped Brandon Young with Cade Povich and Tyler Wells as “AAAA-type arms” Baltimore would be in trouble relying on for an extended period. Four months later, Young is 8-2 with a 3.25 ERA and has arguably been the most consistent starter in the rotation. That evaluation no longer holds up.
The harder question is how much of this new version we should believe.
Through 16 starts, Young has thrown 91⅓ innings with a 3.25 ERA, 1.31 WHIP and 74 strikeouts. He is coming off one of his best outings of the year, holding Houston to one run over seven innings while striking out seven. This is not a two-week hot streak or a reliever hiding behind a small sample. Young has given the Orioles roughly half a season of valuable starting pitching.
But that does not necessarily mean he has suddenly turned into an All-Star-caliber pitcher.
The underlying numbers point toward a more complicated, but still encouraging, answer. Young is meaningfully better than he was during his disastrous rookie season. His pitch mix makes more sense, his slider has become a real weapon and hitters are having a harder time barreling the baseball. At the same time, his strikeout and walk rates have barely changed, his expected ERA remains above 4.00 and some of his home-run suppression is unlikely to last.
Put it together and the most reasonable conclusion is that Young has become a legitimate major-league starter, but he’s probably closer to a Dean Kremer rotation piece than a Kyle Bradish one.
The ERA Swing Exaggerates the Change
Young finished his 2025 rookie season with a 6.24 ERA in 57⅔ innings. This year, that number has fallen by nearly three full runs.
The comparison makes it appear as though Young transformed from one of the worst starters in baseball into one of the better ones. Neither description is quite accurate.
Young’s 2025 expected ERA was 4.27, nearly two runs below his actual mark. Opponents produced a .372 wOBA against him even though the quality of their contact and his strikeout and walk totals produced an expected wOBA of .320. He also stranded only 65.1% of the runners who reached base and allowed 1.87 home runs per nine innings.
So Young was not great in 2025, but he was not nearly as bad as his ERA suggested. Bad sequencing, an extreme home-run rate and unfavorable results on balls in play turned a mediocre performance into a disaster.
This year, the relationship has flipped. Young’s expected ERA is almost a run higher than his ERA at 4.22, nearly identical to where it sat last year. His FIP (fielder independent pitching) is a more favorable 3.85, largely because his home-run rate has been cut in half, while his 4.53 xFIP (expected FIP) is almost identical to the 4.52 he posted last season. His strikeout rate has increased only slightly, from 18.4% to 19.0%, while his walk rate has moved from 8.6% to 8.2%.
In other words, the strikeout, walk and fly-ball foundation has not changed much. The results of those fly balls have.
Young was never really a 6.24-ERA pitcher. He probably is not really a 3.25-ERA pitcher, either.
He Stopped Throwing His Worst Pitches
The improvement is not simply the baseball gods apologizing for last season.
Young used six pitches as a rookie, but several of them either overlapped with better offerings or were getting crushed. His cutter and changeup accounted for nearly 14% of his pitches. Opponents produced a wOBA above .600 against each of them.
He has shelved those, replacing them with a sinker and increasing his slider usage from 8.9% to 14.5%. The current mix offers a riding four-seamer, a sinker with considerably more arm-side movement and drop, a vertical splitter, a compact slider and a slower curveball. The cutter and changeup were not only ineffective, they occupied opportunities that could be given to pitches with clearer identities.
The Slider Is the Clearest Breakthrough
The slider provides the strongest evidence that Young has developed rather than merely experienced better fortune.
Last year, hitters missed on only 19.4% of their swings against it. This season, that figure has jumped to 43%. Its putaway rate has climbed from 13.3% to 31%, and plate appearances ending with the slider have produced a 41.5% strikeout rate and a .238 expected wOBA.
The pitch has become tighter and more vertical, with less sweeping horizontal movement. That shape appears to pair more naturally with Young’s two fastballs, particularly against right-handed hitters.
Young still does not strike out many hitters, but he finally has a pitch capable of ending an at-bat without requiring the hitter to put the ball in play. Hitters who could dismiss Young’s breaking ball last season were free to gear up for a fastball. Now they have to account for a pitch that can disappear below or away from the barrel.
That fraction of hesitation can be enough. A hitter does not have to miss entirely for the pitch to work. He can be late on the fastball, reach for the sinker or make contact slightly above or below the center of the baseball.
Which brings us to the most interesting part of Young’s breakout.
Hitters Are Still Making Hard Contact
Young’s average exit velocity was 89.4 mph last season, exactly the same as this season. His hard-hit rate was 42.2% and remains exactly 42.2%. So, hitters are still making hard contact just as often, but they are not doing as much damage.
Young’s barrel rate has fallen from 10.2% to 6.1%. His flare and burner rate has risen from 18.2% to 28%, while his popup rate has increased from 5.9% to 8.5%. His pull rate has fallen from approximately 48% to 42%, with straightaway contact climbing from roughly 31% to 39%.
Hitters are still swinging hard. They are just meeting the baseball in the wrong place more often. That explains how Young can allow the same average exit velocity and hard-hit percentage while giving up far fewer home runs. A 100 mph batted ball can be a home run, but it can also be a hard grounder, a low line-drive single, a high fly ball or a routine popup. Launch angle, direction and the precise location of contact matter just as much as raw exit velocity.
Young has been much better at creating near-misses.
The addition of the sinker may be the most important structural change in the arsenal. His four-seamer averages approximately 94.3 mph, with the sinker around 93.6. The hitter receives almost no velocity clue to distinguish between the two, but they arrive on considerably different paths.
The four-seamer has useful ride and stays above the trajectory hitters expect, while the sinker runs farther toward the arm side and drops approximately six additional inches. A hitter attempting to stay through the sinker can get underneath the four-seamer or contact it deeper in the zone than intended.
That is a plausible explanation for the combination of fewer pulled balls, more straightaway contact and fewer barrels. Hitters have to wait longer to determine which fastball they are seeing, leaving less time to get the barrel fully extended out front.
The four-seamer is also benefiting from the rest of the arsenal. Opponents are hitting only .195 against it after batting .277 last season, and its whiff rate has risen from 18.8% to 22%.
Unfortunately, this is also one of the clearest areas for regression. The expected batting average against the pitch is .239 rather than .195, while its expected wOBA is .334 compared with an actual .288. The fastball is playing better because of improved velocity, sequencing and the pitches surrounding it. The results still make it look better than it probably is on its own.
There is a reasonable case that Young’s improvement might be even more sustainable than his expected ERA suggests. Expected statistics evaluate the result of each pitch or batted ball, but they do not always capture the full interaction of a pitcher’s arsenal.
Young’s four-seamer may not look dominant in isolation, but it does not exist in isolation. Hitters must distinguish it from the sinker while protecting against a much better slider and a slower splitter.
His chase rate has risen from 27.8% to 34.8%, placing him among baseball’s better pitchers at getting hitters to expand the zone. Chase contact has fallen, and his first-pitch strike rate has increased from 62.1% to 66.4%. Young is controlling plate appearances more effectively even if the improvement has not produced a dramatic strikeout jump.
It is also possible that the reduced barrel rate represents a repeatable skill created by the interaction of his pitches. If Young continues preventing hitters from pulling the ball in the air, his home-run rate could remain below what xFIP expects.
But we should be cautious how much we read into that, because it could be due for some regression. Young’s 7.8% home-run-to-fly-ball rate is less than half last season’s 17.1%. Some of that decline is earned, but neither extreme is a reasonable expectation going forward. Statcast estimates that his nine home runs allowed this season are almost exactly what the batted balls deserved, but the concern is that future fly balls may be more damaging if his command or timing disruption slips even slightly.
With a strikeout rate below 20% and a walk rate above 8%, Young does not have much margin for error. He needs the barrel suppression to continue because he is still asking his defense to record a large percentage of his outs.
What Should We Expect the Rest of the Year?
The pessimistic projection is that Young’s ERA collapses back toward the median between last year’s bad and this year’s good.
However, that is no sure thing and there are real reasons to believe he is a better pitcher this season. The slider is substantially better. The sinker gives hitters another fastball shape to identify. The chase rate has jumped. Two heavily punished pitches have been removed. The barrel reduction is supported by meaningful changes in contact direction and type.
So while he may be in for some regression, there is good reason to believe his true level is much better than last year’s results.
A realistic expectation is something in the 4.00 to 4.40 ERA range for the rest of the season. That likely means plenty of competitive five- and six-inning starts, some nights when the contact finds gloves and occasional rough outings when the fly balls leave the park.
If Young makes most of his remaining turns and pitches at that level, his final season ERA would likely remain in the mid-to-upper 3.00s. That would still represent a tremendous outcome for a pitcher who entered spring training outside the projected rotation.
Workload could become another consideration. Young threw 111 total innings in 2024 and approximately 91 between the majors and minors last season. He is already at 108 combined innings this year, including his brief time at Norfolk. That does not guarantee a shutdown, but it gives the Orioles reason to monitor him rather than assuming he will make every remaining start without interruption.
The bottom line is that Young’s breakout is real, but the ERA has gotten ahead of the improvement. He has rebuilt his arsenal well enough to turn last season’s barrels into this season’s near-misses. That makes him a legitimate starter.
This season may ultimately be a lost cause, but Young proving he can be at least a back of the rotation starter is a positive outcome either way. With Bradish and Baz signed long term, Young can now potentially pair with Kremer to solidify the back end of the rotation going forward. Now if they can just add a true ace (or two), they may be in business.